
1 Overview of the results
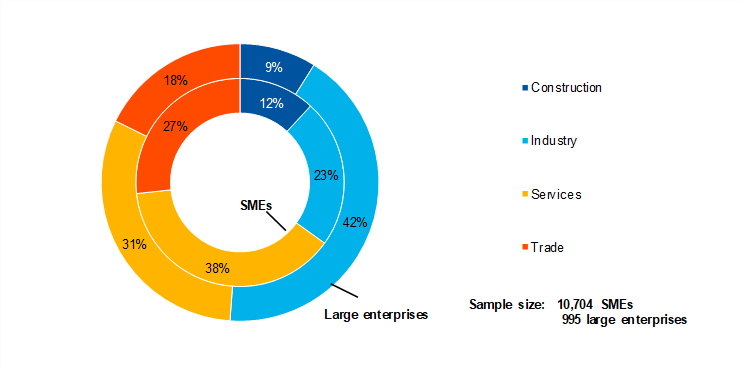
This report presents the main results of the 30th round of the Survey on the Access to Finance of Enterprises (SAFE) in the euro area, which was conducted between 1 February and 12 March 2024. The survey covered the period from October 2023 to March 2024. Half of the firms were surveyed about economic and financing developments over that six-month period (October 2023-March 2024), while the other half of the firms were surveyed about the three-month period between January and March 2024.[1] The sample comprised 11,699 enterprises in the euro area, of which 10,704 (91%) had fewer than 250 employees.[2]
Starting from this round, the survey will become quarterly and will include a set of new quantitative questions on euro area inflation expectations. It will also focus on firms’ expectations of their selling prices, wage costs, other input costs and employment. Two pilot survey rounds were run in June and December 2023 to test the new questions as well as the frequency of the survey. This report will include the results of the second pilot, which covered the last quarter of 2023. The charts on selling price and inflation expectations will also report on the results of the first pilot, covering the second quarter of 2024.
The survey results suggest a further tightening of firms’ financing conditions over the first quarter of 2024, but to a much lesser extent than in the previous survey round (Chart 1 in Section 2). The net percentage[3] of firms reporting an increase in interest rates on bank loans in the first quarter of 2024 declined sharply to 43%, compared with 75% in the last quarter of 2023. At the same time, a net 37% (down from 49%) of firms reported an increase in other costs of financing (i.e. charges, fees and commissions).
Firms reported a modest reduction in the need for bank loans, while fewer firms reported a reduction in the availability of bank loans, resulting in a smaller increase in the financing gap than in the previous survey round (Table 1, columns 9-10 at the end of this section and Chart 2 in Section 2). In net terms, fewer firms reported needs for bank loans (-1%, compared with 4% signalling increases in the last quarter of 2023). As firms perceived the availability of bank loans to have deteriorated, but less than in the previous period (-3%, after -9%), the change in the financing gap for bank loans – the difference between the change in needs and the change in the availability – was reported to be positive for around 2% of firms, down from 8% in the last quarter of 2023. Looking ahead, firms have become more optimistic about the availability of bank loans over the next three months.
Firms perceive the economic outlook to be the main factor hampering the availability of external financing, but slightly less so than in the previous survey round (Chart 5 in Section 2). In the first quarter of 2024 a net 26% of firms reported that the economic outlook had negatively affected the availability of external financing, compared with a net percentage of 32% reporting a deterioration in the last quarter of 2023. The firm-specific outlook was reported as adversely affecting the availability of external finance by a net 5% of firms, similar to the previous quarter.
Firms’ perceptions of banks’ willingness to lend, which reflect banks’ risk aversion, improved further (Chart 6 in Section 2). On balance, 4% of firms reported an improvement in banks’ willingness to lend, up from 1% in the previous survey round, with both SMEs and large firms signalling a slightly better attitude of banks towards them.
Firms continued to report applying for fewer bank loans, mainly due to sufficient availability of internal funds (Chart 8 in Section 2). In the first quarter of 2024 the share of firms applying for bank loans declined to 17% (down from 23%), with the decline common across size classes. In this survey round, the shares were the lowest recorded since the survey was first launched. The most common reason reported by firms for not applying is the amount of internal funds at their disposal, which firms consider sufficient to finance their business plans.
Not many firms reported obstacles to obtaining a bank loan. Among enterprises that judged bank loans to be relevant, 5% reported obstacles when seeking to obtain a loan, broken down into 6% for SMEs and 2% for large firms (Table 1, columns 11 and 12 in this section, and Chart 9 in Section 2).
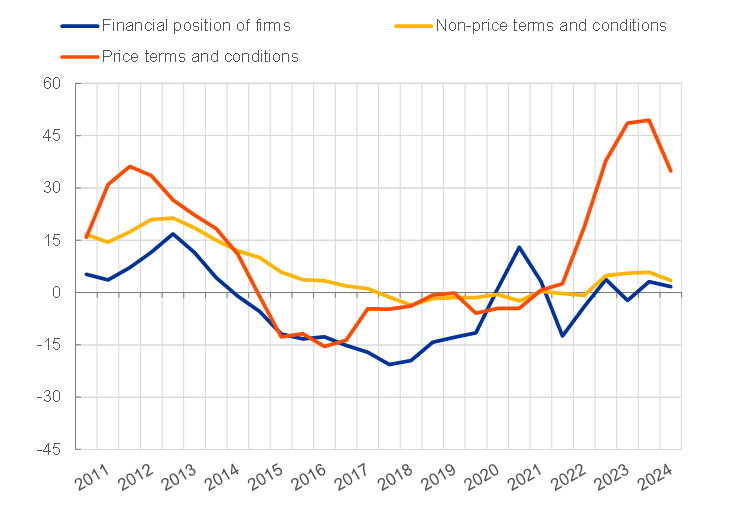
An indicator reflecting firms’ price terms and conditions of financing suggests a further tightening in the period covering both the last quarter of 2023 and the first quarter of 2024, albeit to a smaller extent than in the previous six months (Chart A in this section). This indicator covers changes in firms’ bank interest rates and other costs related to bank financing (charges, fees and commissions) and is one of three “principal components” reflecting how euro area firms perceive financing conditions.[4] In this survey round, a net 35% of firms reported a deterioration in price terms and conditions, significantly down from the peak of 49% reached in 2023. The continuing decline reflects the ongoing transmission of past monetary policy tightening to firms’ financing costs. The two other indicators of financing conditions, mostly considering the firms’ financial position and non-price terms and conditions, remained mainly unchanged, pointing to some moderate tightening.
Chart A
Change in overall financing conditions as perceived by euro area firms
(over the preceding six months; weighted average scores in percentages)
Base: All enterprises.
Notes: The three indicators are derived from factor analysis using firm-level survey replies since 2010 The financial position of the firms summarises the impact of changes in profits, own capital and creditworthiness on firms’ financing conditions. The price terms and conditions indicator captures changes in bank interest rates and other costs of bank financing (charges, fees and commissions), while the non-price terms and conditions indicator reflects changes in collateral requirements and other guarantees. The aggregate indicator is the average of firm-level scores, weighted by size, economic activity and country. Positive values indicate a deterioration in firms’ financing conditions. The individual scores are standardised, meaning that they have a range of between -1 and 1 and are multiplied by 100.
Fewer enterprises reported an increase in turnover over the last three months. A net 3% reported increased turnover (Chart 10 in Section 3), compared with 10% in the previous quarter. The increased turnover was mainly recorded by larger firms. Looking forward, firms are quite optimistic about future turnover outcomes, with 30% of them expecting on net future increases.
More firms saw a deterioration in profits, as labour and other costs increased further. The net percentage of euro area enterprises that signalled a decline in their profits was slightly above the net percentage reported in the previous survey round (-19% compared with -15%). The survey replies show that cost pressures remain widespread, but declining, particularly so for interest expenses.
The financial vulnerability of euro area enterprises remained high, with percentages close to those seen during the pandemic (Chart 11 in Section 3). According to this indicator, 7% of euro area enterprises encountered major difficulties in running their business and servicing their debts over the past three months (unchanged from the previous round).
Firms expect the increases in their selling prices and wages to moderate over the next 12 months (Chart 13 in Section 3.3). Selling prices are expected to increase by 3.3% on average (down from 4.5% in the previous survey round) and wages by 3.8% (down from 4.5% in the previous survey round). On average, SMEs expect higher increases than large firms in both their selling prices (3.9% compared with 2.5%) and wage costs (3.9% compared with 3.6%) over the coming year. A more granular analysis shows that higher expected wage costs tend to be associated with higher selling price expectations for firms in the SAFE, with the relationship remaining quite stable over the past year (Box 1 in Section 3). Furthermore, firms with rising profits exhibit a stronger relationship between expected wage changes and expected selling price changes than firms with falling profits.
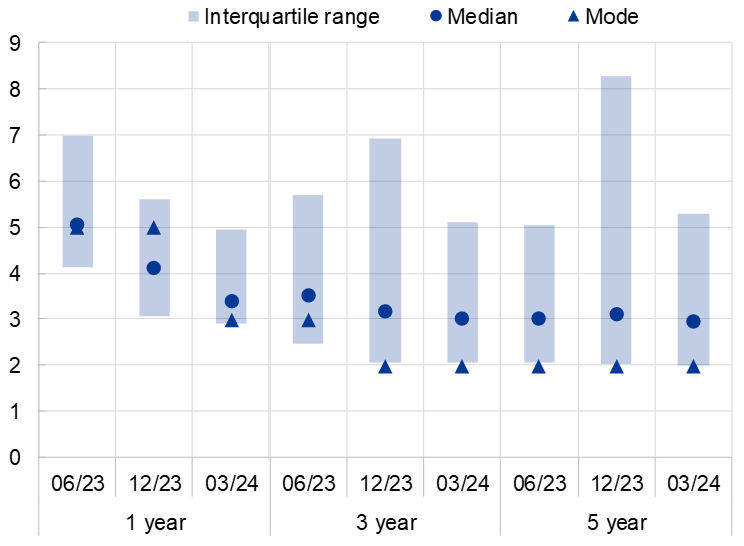
Inflation expectations continued to decline, and disagreement about the inflation outlook also moderated. Median inflation expectations stood at 3.4%, 3.0% and 3.0% for annual inflation in one, three and five years respectively, representing a decline of 0.7, 0.2 and 0.1 percentage points across horizons. Firms’ disagreement about the inflation outlook, as measured by the interquartile range of inflation expectations, also declined by 0.6 percentage points for the one-year horizon. Disagreement declined at all horizons. Regarding inflation in five years, a high share of firms (49%) perceives that the risks to the outlook are tilted to the upside.
Table 1
Latest developments in SAFE country results for euro area firms
(net percentages and percentages of respondents)
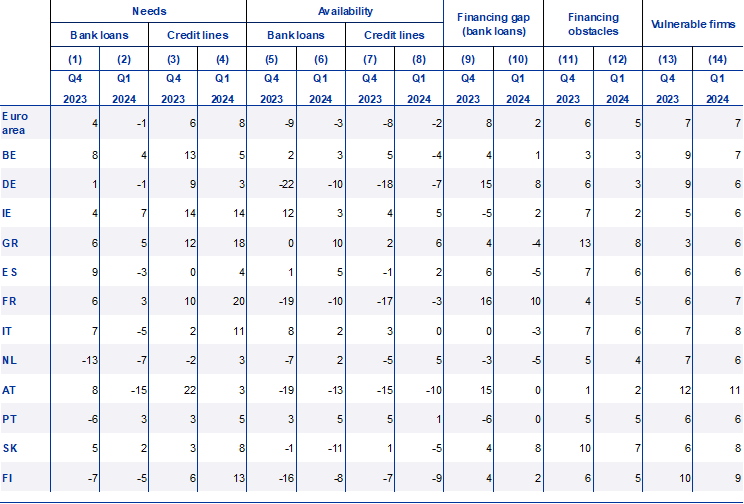
Notes: For the “financing gap”, see the notes to Chart 2; for “financing obstacles”, see the notes to Chart 9; for “vulnerable firms”, see the notes to Chart 11. “Q4 2023” refers to pilot 2 (October-December 2023) and “Q1 2024” refers to round 30 (January-March 2024). Financing obstacles and vulnerable firms refer to the percentages of respodents, while the other indicators in the table are expressed in net percentages.
2 Firms’ financing conditions
2.1 Firms’ costs of bank loans continued to rise but much less than in the previous survey round
Firms continued to report rising bank interest rates and other costs of bank financing, though with lower shares than in the previous survey round (Chart 1). In the first quarter of 2024 the share of firms reporting an increase in bank interest rates declined strongly, to 43% compared with 75% in the last quarter of 2023. The lower percentage is consistent with the slight narrowing of margins on average loans together with the moderate tightening of credit standards reported by the euro area bank lending survey in the same period. At the same time, a net 37% of firms (down from 49%) reported an increase in other costs of financing (i.e. charges, fees and commissions) and 12% (down from 21%) stricter collateral requirements as well. Looking at a longer perspective, the percentages are still close to record highs. Across size classes, both SMEs and large firms signalled similar developments in bank interest rates; the rise in other costs of bank loans was more widespread among SMEs than large firms.
Chart 1
Changes in the terms and conditions of bank financing for euro area enterprises
(net percentages of respondents)
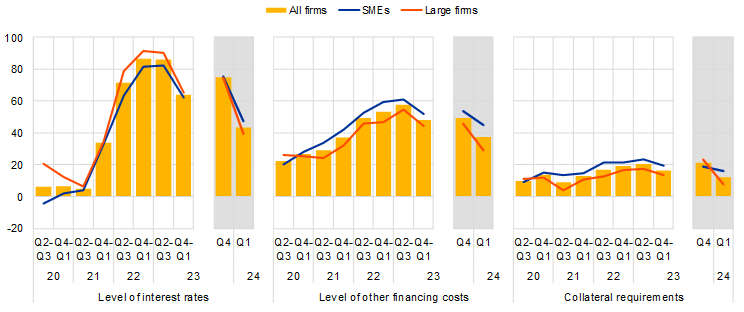
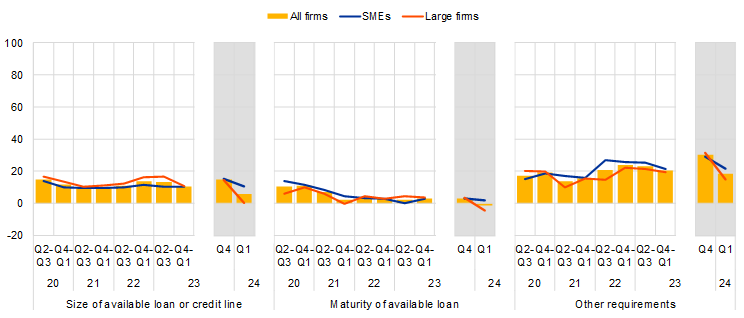
Base: Enterprises that had applied for bank loans (including subsidised bank loans), credit lines, or bank or credit card overdrafts. The figures refer to rounds 23 to 30 of the survey (April-September 2020 to January-March 2024).
Notes: Net percentages are the difference between the percentage of enterprises reporting an increase for a given factor and the percentage reporting a decrease. The data included in the chart refer to Question 10 of the survey. The grey areas represent responses to the same question within a reference period of three months, whereas the main charts cover a reference period of six months.
2.2 A reduction in needs and a small decline in the availability of external financing contributed to a smaller increase in the financing gap
Firms reported a modest reduction in the need for bank loans (Chart 2). In the first quarter of 2024 a net 1% of companies reported lower needs for bank loans (down from 4% signalling increases in needs in the previous survey round). While a net 1% of SMEs indicated a decline in their need for bank loans (the same as in the last quarter of 2023), the corresponding net percentage for large firms was 2% (down from 12% indicating an increase in the previous survey round).
Fewer firms reported a deterioration in the availability of bank loans (Chart 3).[5] The net percentages of firms reporting a deterioration in the availability of bank loans declined to 3%, smaller than in the previous quarter (-9%). Across size classes, more SMEs reported a deterioration in the availability of bank loans (net -4%) than large firms (-2%).
Consequently, the change in the financing gap for bank loans – the estimated difference between the change in needs and the change in availability – was positive for around 2% of firms, down from 8% in the last quarter of 2023.
Chart 2
Changes in euro area enterprises’ financing needs and the availability of bank loans
(net percentages of respondents)

Base: Enterprises for which the instrument in question is relevant (i.e. they have used it or considered using it). Respondents replying “not applicable” or “don’t know” are excluded. The figures refer to rounds 23 to 30 of the survey (April-September 2020 to January-March 2024).
Notes: The financing gap indicator combines both financing needs and the availability of bank loans at firm level. The indicator of the perceived change in the financing gap takes a value of 1 (-1) if the need increases (decreases) and availability decreases (increases). If enterprises perceive only a one-sided increase (decrease) in the financing gap, the variable is assigned a value of 0.5 (-0.5). A positive value for the indicator points to a widening of the financing gap. Values are multiplied by 100 to obtain weighted net balances in percentages. The data included in the chart refer to Questions 5 and 9 of the survey. The grey areas represent responses to the same question within a reference period of three months, whereas the main charts cover a reference period of six months.
Firms continued to report an increase in their financing needs for trade credit but less than in the previous survey round, with almost no changes in the availability (Chart 3). A net 6% of companies reported higher needs for trade credit (down from 10% in the previous survey round), possibly reflecting the intention by firms to substitute short-term bank finance with trade credit. At the same time, the net percentage of firms signalling increased availability remained broadly unchanged at 1%, mostly because of the subdued economic activity. Hence, the change in the financing gap for trade credit remained positive, but slightly lower in the first quarter of 2024 compared with the previous quarter.
Firms’ needs for credit lines increased on net, while the availability continued to decline, but less than in the last quarter of 2023 (Chart 3). In this survey round 8% reported increased needs for credit lines (up from 6%). At the same time, the percentage of firms signalling declines in the availability of credit lines reached 2%, down from 8% in the last quarter of 2023. Hence, the change in the financing gap for credit lines remained positive and higher than for bank loans.
Chart 3
Changes in euro area enterprises’ financing needs and the availability of trade credit and credit lines
(net percentages of respondents)

Base: Enterprises for which the instrument in question is relevant (i.e. they have used it or considered using it). Respondents replying “not applicable” or “don’t know” are excluded. The figures refer to rounds 23 to 30 of the survey (April-September 2020 to January-March 2024).
Notes: For a description of the indicator, see the notes to Chart 2. The data included in the chart refer to Questions 5 and 9 of the survey. The grey areas represent responses to the same question within a reference period of three months, whereas the main charts cover a reference period of six months.
2.3 Firms expect the availability of external financing to improve
Looking ahead, firms are more optimistic about the availability of external financing over the next three months (Chart 4). A net 3% of firms expect access to bank loans to improve over the next three months, while the corresponding figure for credit lines and trade credit is 2% on both cases. Compared with large firms, fewer SMEs expect to see an improvement in bank loans and trade credit. By contrast, SMEs are slightly more optimistic on the future availability of credit lines. In this survey round, firms’ expectations about the future availability of external financing could be indicative of a near-term pick-up in external finance. Likewise, firms also expect the availability of internal funds to increase.
Chart 4
Changes in euro area enterprises’ expectations regarding the availability of financing
(next six-month period; net percentages of respondents)

Base: Enterprises for which the instrument in question is relevant (i.e. they have used it or considered using it). The figures refer to rounds 23 to 30 of the survey (April-September 2020 to January-March 2024).
Notes: See the notes to Chart 1. The data included in the chart refer to Question 23 of the survey. The grey areas represent responses to the same question within a reference period of three months, whereas the main charts cover a reference period of six months.
2.4 Euro area enterprises perceived the general economic outlook as negatively affecting the availability of external finance
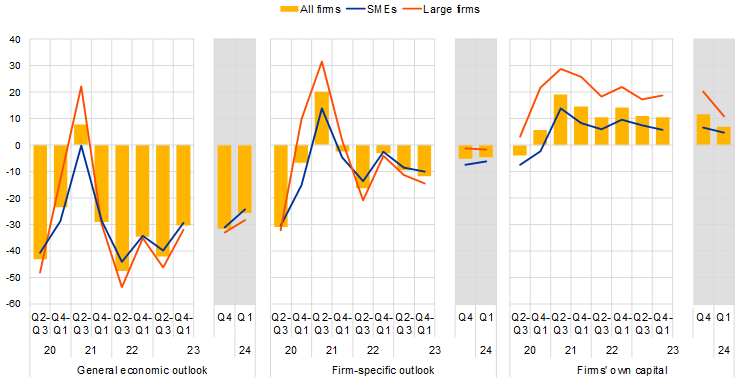
Firms perceived the general economic outlook as the main factor hampering the availability of external financing, albeit to a slightly lesser extent than in the previous survey round (Chart 5). In the first quarter of 2024 a net 26% of firms reported that a deterioration in the general economic outlook had reduced the availability of external financing (compared with a net total of -32% in the last quarter of 2023). The net percentage of firms indicating a deterioration in their firm-specific outlook remained at -5%. Large firms continued to be more pessimistic about the impact of the outlook for the general economy than SMEs, when looking at the recent past in general and since the last quarter of 2021 in particular. By contrast, firms reported an improvement in their own capital position (net 7%, from 12%) and creditworthiness (net 12%, down from 11%). These factors thus continue to have a positive impact on access to finance in this survey round.
Chart 5
Changes in factors that have an impact on the availability of external financing to euro area enterprises
(net percentages of respondents)
Base: All enterprises. The figures refer to rounds 23 to 30 of the survey (April-September 2020 to January-March 2024).
Notes: See the notes Chart 1.. The data included in the chart refer to Question 11 of the survey. The grey areas represent responses to the same question within a reference period of three months, whereas the main charts cover a reference period of six months.
Firms reported an increase in the willingness of banks to lend (Chart 6). On balance, 4% firms reported an improvement in banks’ willingness to lend, up from 1% in the previous survey round, with both SMEs and large firms signalling a slightly better attitude of banks towards them. At the same time, firms reported that business partners were slightly more willing to provide trade credit (a net total of 5%, up from -2% in the previous round), with the increase for large firms being more marked than for SMEs.
Chart 6
Changes in factors that have an impact on the availability of external financing to euro area enterprises
(net percentages of respondents)

Base: All enterprises; for the category “willingness of banks to lend”, enterprises for which at least one bank financing instrument (credit line, bank overdraft, credit card overdraft, bank loan or subsidised bank loan) is relevant. The figures refer to rounds 23 to 30 of the survey (April-September 2020 to January-March 2024).
Notes: See the notes to Chart 1. The data included in the chart refer to Question 11 of the survey. The grey areas represent responses to the same question within a reference period of three months, whereas the main charts cover a reference period of six months.
2.5 Firms used financing primarily for fixed investment and for inventories and working capital
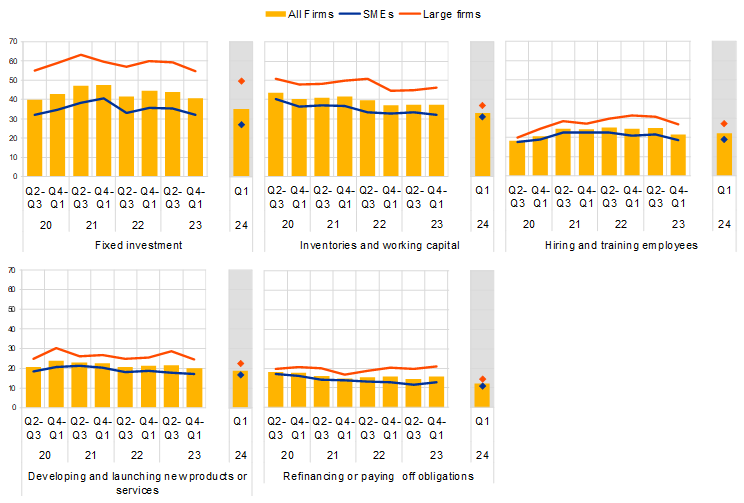
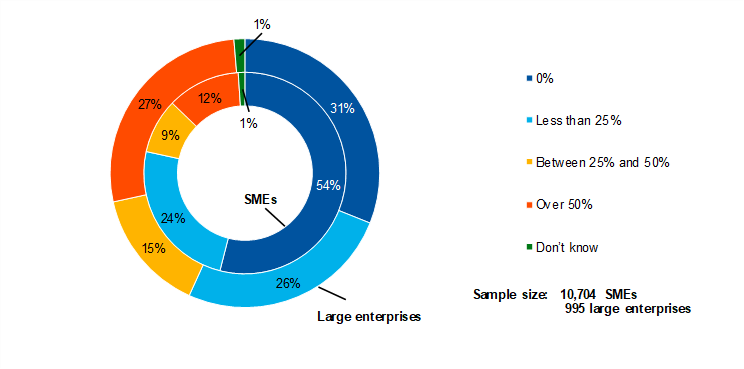
Financing from internal and external sources continued to be used mainly for fixed investment and for inventories and working capital (Chart 7). Fixed investment was still reported as the most common purpose of financing (35% of firms in the first quarter of 2024), followed by inventories and working capital (33%). The share of large firms investing continued to be much higher than that of SMEs for fixed investments (49% versus 27%) as well as for inventories and working capital (37% versus 31%). As firms were not asked about the purpose of financing in the last quarter of 2023, a comparison can only be made with the long-term perspective of the previous six months. The overall dynamics show a further reduction in the net percentage of firms investing in fixed investment, in line with the current weak investment activity, and no major changes in that for inventories and working capital.
Chart 7
Purpose of financing as reported by euro area enterprises
(percentages of respondents)
Base: All enterprises. The figures refer to rounds 23 to 30 of the survey (April-September 2020 to January-March 2024).
Notes: The data included in the chart refer to Question 6A of the survey. The grey areas represent responses to the same question within a reference period of three months, whereas the main charts cover a reference period of six months.
2.6 Applications for bank loans continued to fall, while overall financing obstacles are slightly on the decline
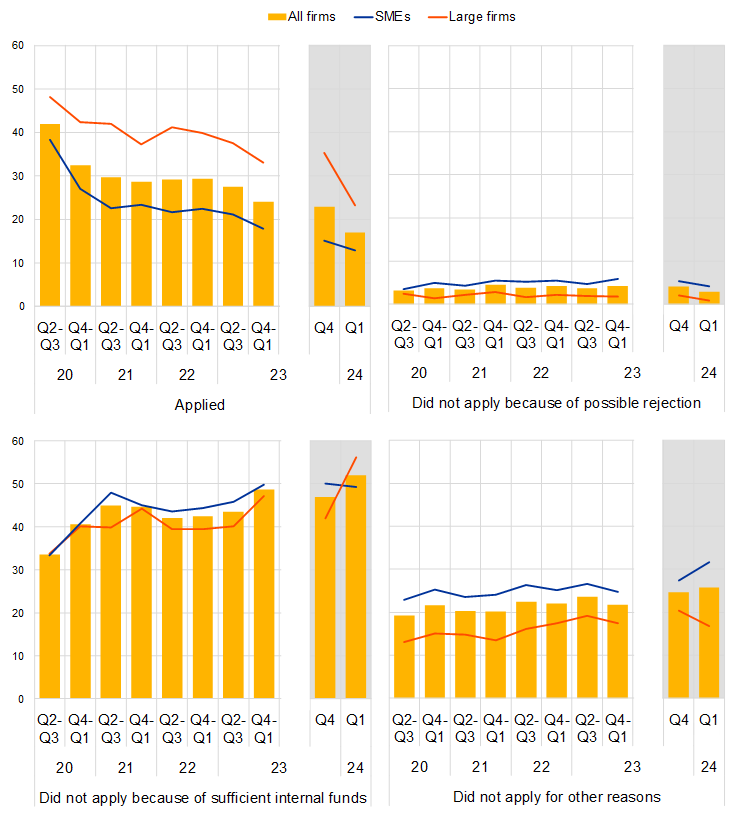
Firms continued to report lower applications for bank loans (Chart 8). In the first quarter of 2024 the share of applications for bank loans declined to 17% (down from 23%) and the decline was common across size classes. Few firms felt discouraged from applying for bank loans (3%, down from 4%). From a historical perspective, the share of bank loan applications showed a spike during the initial phase of the pandemic, mainly due to the incentives to apply provided by public support, and a remarkable decrease during the monetary policy tightening cycle. In this survey round, the shares were the lowest recorded since the survey was first launched.
The most common reason stated by firms for not applying is the amount of internal funds at their disposal, which firms consider sufficient to finance their business plans. The share of firms stating they did not apply for bank loans due to having sufficient internal funds available has increased since the pandemic, in particular for SMEs. In the first quarter of 2024 52% of firms were signalling this reason (up from 47% in the previous quarter), with more large firms doing so (56%) than SMEs (49%).
Chart 8
Applications for bank loans by euro area enterprises
(percentages of respondents)
Base: Enterprises for which bank loans (including subsided bank loans) are relevant. The figures refer to rounds 23 to 30 of the survey (April-September 2020 to January-March 2024).
Notes: The data included in the chart refer to Question 7A of the survey. The grey areas represent responses to the same question within a reference period of three months, whereas the main charts cover a reference period of six months.
According to an overall indicator of financing constraints, fewer firms reported obstacles to obtaining a bank loan (Chart 9). Among enterprises that considered bank loans to be relevant for their enterprise, 5% reported obstacles when seeking to obtain a loan, with net percentages of 6% for SMEs and 2% for large firms. All percentages were lower than those reported in the last quarter of 2023. In a long-term perspective, financing obstacles perceived by firms seem to have stabilised, with persistently higher obstacles for SMEs than large firms. Discouraged borrowers (firms that do not apply for bank loans even if they would need them) represent the largest fraction of financially constrained firms (3% of all firms in the current survey round), mostly among SMEs.
Chart 9
Obstacles to obtaining a bank loan
(percentages of respondents)

Base: Enterprises for which bank loans (including subsidised bank loans) are relevant. The figures refer to rounds 23 to 30 of the survey (April-September 2020 to January-March 2024).
Notes: Financing obstacles are defined here as the total of the percentages of enterprises reporting (i) loan applications that resulted in an offer that was declined by the enterprise because the borrowing costs were too high, (ii) loan applications that were rejected, (iii) a decision not to apply for a loan for fear of rejection (discouraged borrowers), and (iv) loan applications for which only a limited amount was granted. The grey areas represent responses to the same question within a reference period of three months, whereas the main charts cover a reference period of six months.
3 The economic situation of euro area firms
3.1 Turnover increased very modestly, with costs weighing on profitability
Fewer enterprises reported an increase in turnover over the last three months (Chart 10). The net percentage of euro area firms reporting an increase in turnover declined to 3% (down from 10% in the last quarter of 2023). Across firm sizes, a small net percentage of SMEs reported a decline in turnover (-3% down from 3% reporting an increase), while large firms continued to signal increases, though less than in the previous survey round (12% versus 22%). Taking a longer perspective, increases in turnover have consistently been reported by fewer firms since the end of 2022, reflecting weak private consumption and global demand coupled with declining inflation.
Chart 10
Changes in the economic situation of euro area enterprises
(net percentages of respondents)
Base: All enterprises. The figures refer to rounds 23 to 30 of the survey (April-September 2020 to January-March 2024).
Notes: See the notes to Chart 1. The data included in the chart refer to Question 2 of the survey. The grey areas represent responses to the same question within a reference period of three months, whereas the main charts cover a reference period of six months.
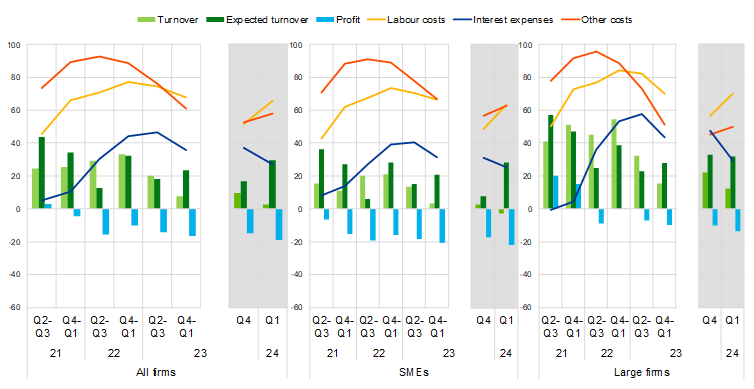
More euro area firms reported a deterioration in their profits than in the previous survey round. The net percentage of euro area enterprises that signalled a decline in their profits was slightly above that in the previous survey round (-19% compared with -15%). SMEs seem to be facing greater profitability issues. A net 22% of SMEs reported lower profits (compared with 17% in the previous survey round), compared with 13% of large firms (10% in the previous survey round).
The deterioration in profitability continues to reflect a widespread increase in labour and other costs related to materials and energy. A net 66% of firms reported higher labour costs (up from 52% in the previous quarter), while the net share of firms indicating rising costs for materials and energy was 58% (up from 53% in the previous quarter). Looking at a longer horizon, however, both labour and other cost pressures started weakening at the beginning of 2023.
Increasing interest expenses are a further drag on profitability, albeit less than in the previous survey rounds. The net share of firms reporting increased interest expenses declined to 27% (down from 37%), with large firms (29%) being slightly more affected by rising interest expenses than SMEs (25%).
The financial vulnerability of euro area enterprises remained high, with totals close to those seen during the pandemic (Chart 11). The financial vulnerability indicator, which provides a comprehensive picture of firms’ financial situation, suggests that 7% of euro area enterprises encountered major difficulties in running their business and servicing their debts over the past three months (unchanged from the previous round).[6] At the other end of the spectrum, the share of financially resilient firms (those that are more likely to withstand adverse shocks) increased slightly, to 4%.
Chart 11
Vulnerable and financially resilient firms in the euro area
(percentages of respondents)
a) Vulnerable firms
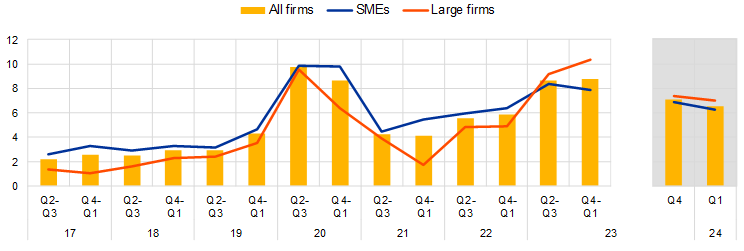
b) Financially resilient firms

Base: All enterprises. The figures refer to rounds 17 to 30 of the survey (April-September 2017 to January-March 2024).
Notes: For a definition of “vulnerable firms” and “resilient firms”, see footnote 6 The data included in the chart refer to Question 2 of the survey. The grey areas represent responses to the same question within a reference period of three months, whereas the main charts cover a reference period of six months.
3.2 Investment activity was weak, but firms expect an improvement
Fewer enterprises reported increased investment over the last three months (Chart 12). The net share of firms reporting a rise in investment declined to 5% from 11% in the last quarter of 2023, with large firms reporting the biggest decline. The change is in line with other survey results showing rather weak investment activity by non-financial corporations in the first quarter of 2024. When asked about investment in the coming quarter, firms were more optimistic across size classes.
Chart 12
Changes in realised and expected fixed investments of euro area enterprises
(net percentages of respondents)
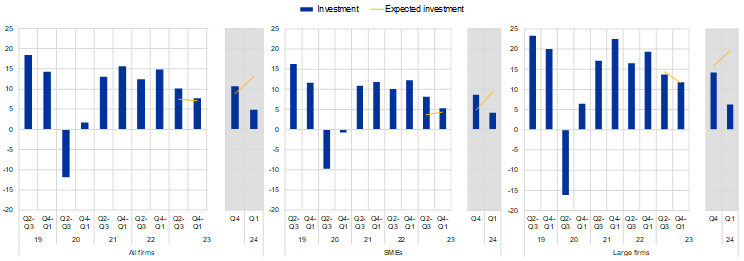
Base: All enterprises. The figures refer to rounds 21 to 30 of the survey (April-September 2019 to January-March 2024).
Notes: See the notes to Chart 1. Bars refer to developments over the preceding six months and lines to expectations over the next six months. The data included in the chart refer to Questions 2 and 26 of the survey. The question on Expected investments was first included in the questionnaire in Q2-Q3 2023.The grey areas represent responses to the same question within a reference period of three months, whereas the main charts cover a reference period of six months.
3.3 Firms expect the growth of their selling prices and wages to moderate further over the next year
Firms expect their selling prices to increase by 3.3% on average over the next 12 months (down from 4.5% in the previous survey round), while the corresponding number for wages is 3.8% (down from 4.5%; Chart 13). Similarly, median selling price and wage expectations have also fallen since the last survey round (3%, after 4% both for selling prices and wages). While the dispersion of selling price expectations is similar to the last survey round, more firms indicate expecting selling prices to remain unchanged in this round. The 25th percentile of the distribution for selling price expectations is 0, demonstrating that at least a quarter of firms in the survey expect prices to remain unchanged or to decline over the next year (compared with 1% expected price change in December 2023).[7]
Both SMEs and large firms’ expectations about selling price and wage increases over the next year have eased compared with the previous survey round. On average, SMEs expect higher increases than large firms in both their selling prices (3.9% compared with 2.5%) and wage costs (3.9% compared with 3.6%) over the next year (Chart 14).
Chart 13
Expectations for selling prices, wages, input costs and employees one year ahead
(percentage change over the next 12 months)
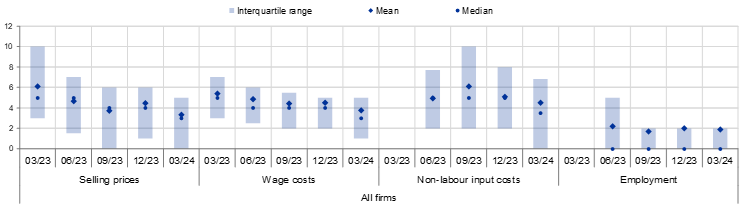
Base: All enterprises. The figures refer to: round 28 (October 2022-March 2023), pilot 1 (March-June 2023), round 29 (April-September 2023), pilot 2 (October-December 2023) and round 30 (January-March 2024) of the survey, with firms’ replies collected in the last month of the respective survey waves.
Notes: Mean and median euro area firm expectations of changes in selling prices, wages of current employees, non-labour input costs and number of employees for the next 12 months, along with interquartile ranges, using survey weights. The statistics are computed after trimming the data at the country-specific 1st and 99th percentiles. The data included in the chart refer to Question 34 of the survey. Questions on non-labour input costs and employees were not available in round 28.
Chart 14
Expectations for selling prices, wages, input costs and employees one year ahead, by size class
a) SMEs
(percentage change over the next 12 months)
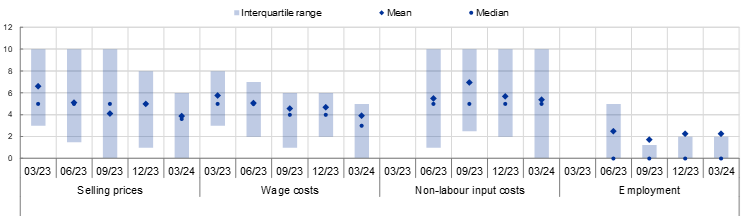
b) Large firms
(percentage change over the next 12 months)

Base: All enterprises with fewer than 250 employees (panel a) and all enterprises with 250 or more employees (panel b). The figures refer to: round 28 (October 2022-March 2023), pilot 1 (March-June 2023), round 29 (April-September 2023), pilot 2 (October-December 2023) and round 30 (January-March 2024) of the survey, with firms’ replies collected in the last month of the respective survey waves.
Notes: Mean and median euro area firm expectations of changes in selling prices, wages of current employees, non-labour input costs and number of employees for the next 12 months, along with interquartile ranges, using survey weights. The statistics are computed after trimming the data at the country-specific 1st and 99th percentiles. The data included in the chart refer to Question 34 of the survey. Questions on non-labour input costs and employees were not available in round 28.
Comparing developments across sectors (Chart 15), firms in services expect their selling prices and wages to increase more than in other sectors (4.2% compared with 2.6% for selling prices and 4.1% compared with 3.6% for wage increases).
Chart 15
Average expectations for selling prices, wages and input costs one year ahead, by sector
(percentage change over the next 12 months)

Base: All enterprises. The figures refer to: round 28 (October 2022-March 2023), pilot 1 (March-June 2023), round 29 (April-September 2023), pilot 2 (October-December 2023) and round 30 (January-March 2024) of the survey, with firms’ replies collected in the last month of the respective survey waves.
Notes: Mean euro area firm expectations of changes in selling prices, wages of current employees, non-labour input costs and number of employees for the next 12 months, along with interquartile ranges, using survey weights. The statistics are computed after trimming the data at the country-specific 1st and 99th percentiles. The data included in the chart refer to Question 34 of the survey. Questions on non-labour input costs and employees were not available in round 28.
Firms expect their non-labour input costs to increase by 4.5% on average over the next year, with enterprises in the services sector predicting higher increases (Chart 13 and Chart 15). While the distribution of the expected average increase in non-labour input costs is widely dispersed, a larger share of firms expects no further increase in non-labour input costs as of the first quarter of 2024 compared with the previous survey round. The high degree of dispersion probably reflects differences in the inputs and raw materials used by firms, which may have different price outlooks. SMEs expect a higher increase in non-labour input costs than large firms (5.4% compared with 3%). The median firm expects non-labour input costs to rise by 3.5%, with the median expectation of SMEs standing at 5% and of large firms at 3%.
On average, firms expect their staffing levels to increase by 1.9% over the next year, while the median firm expects zero growth (Chart 13). This reflects the fact that the distribution of expected changes in staffing levels is skewed to the upside, with some firms expecting larger increases but most firms expecting modest increases or no change. The average expected workforce growth for SMEs is slightly higher than for large firms (2.2% compared with 1.4%).
Box 1
The relationship between firms’ expectations for wage cost and selling price across sectors
Higher expected wage costs tend to be associated with higher expected selling prices for firms in the SAFE, with the relationship remaining quite stable over the past year (Chart B). A reduced-form regression which controls for firms’ expected changes in non-labour input costs suggests that a 1 percentage point increase in wage expectations is, on average, associated with 0.22 percentage points higher selling price expectations in the first quarter of 2024. This relationship has become slightly weaker over the last four quarters but remains broadly stable. The results suggest that future decelerations in average wage cost expectations might translate into smaller increases in firms’ selling price expectations, other things being equal, thus highlighting the importance of the wage outlook for future price pressures.
Chart B
The relationship between firms’ wage cost and selling price expectations over time
(change in expected change in selling price associated with a 1 percentage point higher expected change in wage costs, percentage points)

Base: All enterprises. The figures refer to pilot 1 (March-June 2023), round 29 (April-September 2023), pilot 2 (October-December 2023) and round 30 (January-March 2024) of the survey, with firms’ replies collected in the last month of the respective survey waves.
Notes: The chart plots estimated coefficients from regressions, computed separately for each time period, of expected price changes on expected wage changes, controlling for expected changes in other input costs. 95% confidence intervals are shown based on standard errors clustered by firm size class, sector and country.
Firms with increasing profits exhibit a stronger relationship between expected changes in wage costs and expected changes in selling prices than firms with decreasing profits (Chart C).[8] Firms were grouped into two categories based on their replies on profit developments in the first quarter of 2024 or the period from the fourth quarter of 2023 to the first quarter of 2024[9],[10]: those that reported increased profits and those that reported decreased profits. For firms which saw increasing profits, a 1 percentage point increase in wage expectations is, on average, associated with 0.30 percentage points higher selling price expectations, while for firms with decreasing profits the relationship is weaker, implying only 0.17 percentage points higher selling price expectations in the first quarter of 2024.[11]
Chart C
Firm heterogeneity in the relationship between wage cost and selling price expectations
(change in expected change in selling prices associated with a 1 percentage point higher expected change in wage costs, percentage points)

Base: All enterprises. The figures refer to round 30 (January-March 2024) of the survey, with firms’ replies collected in the last month of the respective survey waves.
Notes: The chart shows estimated coefficients from regressions, computed separately for each firm subsample, of expected price changes on expected wage changes, controlling for expected changes in other input costs and fixed effects for firm size classes, sectors and countries. The bars referring to “All firms” are based in part on firms that did not respond to the question on profits, which is the case for half of the firms in the total.
Firms in the services and manufacturing sectors do not differ markedly in the extent to which expected changes in wage costs relate to expected changes in selling prices, but the impact of profits on this relationship is much weaker for service-sector firms (Chart C). Accounting again for non-labour input costs, in both services and manufacturing, a 1 percentage point increase in wage cost expectations is, on average, associated with 0.17 percentage points higher selling price expectations. In the manufacturing sector, firms with increasing profits exhibit a very strong relationship between expected changes in wage costs and expected changes in selling prices: a 1 percentage point increase in wage expectations is, on average, associated with 0.44 percentage points higher selling price expectations, compared with 0.17 percentage points for firms with decreasing profits. In the services sector, for firms with increasing profits, a 1 percentage point increase in wage expectations is associated with increased selling price expectations of only 0.27 percentage points. This means that the reduced-form effect between expected changes in wage costs and selling prices is 56% larger for firms with increasing profits in manufacturing but only 23% larger for firms with increasing profits in services, relative to firms with decreasing profits in the two sectors. These results suggest that those firms having seen more positive profit developments over the recent past also expect to be able to better pass on wage increases to consumers via higher selling prices. That said, some differences remain across sectors, which might be explained by larger market concentration or lower profit buffers.
3.4 Firms’ inflation expectations continue to decline
Euro area firms’ median euro area inflation expectations stand at 3.4%, 3.0% and 3.0% for annual inflation rates in one, three and five years’ time respectively, marking a decline that is most pronounced at short horizons (Chart 16). Compared with December 2023, median inflation expectations thus fell by 0.7, 0.2 and 0.1 percentage points across the one-, three- and five-year horizons. The continued easing of short-term inflation expectations in particular is consistent with the observed disinflationary process. The mode of one-year-ahead inflation expectations declined as well, from 5% in December 2023 to 3% in March 2024. Longer-term mode inflation expectations continue to stand at 2%.
In addition to lower expectations, firms’ disagreement about the inflation outlook declined. The dispersion in inflation expectations, measured by the interquartile range of inflation expectations, decreased from December 2023, from 2.6 percentage points to 2.0 percentage points for one-year-ahead inflation. The range of views on longer-term inflation expectations narrowed substantially compared with the relatively large range of inflation expectations observed in December 2023. This overall decline in disagreement is consistent with firms perceiving lower uncertainty about the inflation outlook at all horizons.
Chart 16
Firms’ expectations for euro area inflation at different horizons
(annual percentages)
Base: All enterprises.
Notes: Survey-weighted median, mode and interquartile ranges of firms’ expectations for euro area inflation in one year, three years and five years. Quantiles are computed by linear interpolation of the mid-distribution function. The statistics are computed after trimming the data at the country-specific 1st and 99th percentiles.
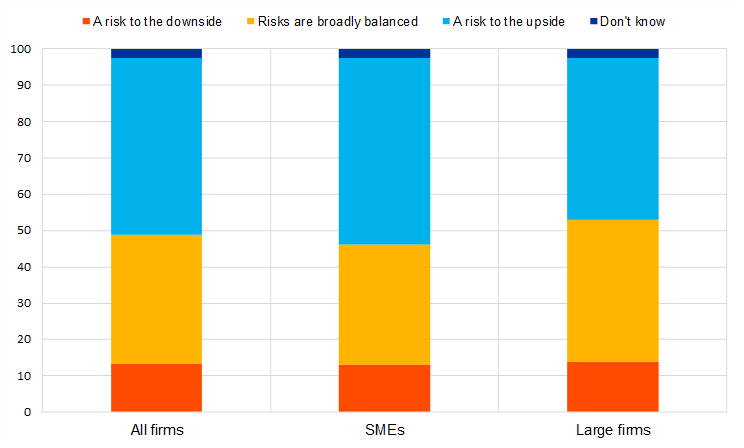
Firms report that the risks to the five-year-ahead inflation outlook are tilted to the upside, with SMEs reporting upside risks slightly more widely (Chart 17). 49% of firms perceive that five-year-ahead inflation risks dominate on the upside, meaning that they find it more likely that inflation will turn out above their point prediction than below. 35% of firms perceive balanced risks and 13% of firms perceive mainly downside risks. While SMEs and large firms perceive the risks to the inflation outlook relatively similarly, slightly more SMEs (51%) report upside risks than large firms (45%). Large firms instead report more often that the risks to the inflation outlook are balanced.
Firms with relatively high point predictions for inflation also perceive upside risks more often (Charts 18). Of the firms that expect inflation in five years to turn out above 5% − meaning at levels much higher than currently observed − 60% perceive that the risks to their outlook are tilted to the upside. By contrast, firms that expect inflation to be between 0% and 3% in five years’ time perceive the risks to their inflation outlook to be relatively more balanced: 40% of those firms perceive mainly upside risks and 42% balanced risks.
Chart 17
Firms’ perceived risks about euro area inflation five years ahead, by firm size
(weighted percentages)
Base: All enterprises. The figures refer to round 30 (January-March 2024) of the survey.
Notes: Survey-weighted percentages of firms’ subjective inflation outlook over the next five years. Firms that answered “don't know” in Question 31 are not considered. The data included in the chart refer to Question 33 of the survey.
Chart 18
Firms’ perceived risks about euro area inflation five years ahead, by inflation point forecast
(weighted percentages)

Base: All enterprises. The figures refer to round 30 (January-March 2024) of the survey.
Notes: Survey-weighted percentages of firms’ subjective inflation outlook over the next five years, filtered between answers from Question 31, for the same five-year outlook period, excluding “don’t know” from Question 31. The data included in the chart refer to Questions 31 and 33 of the survey.
Annexes
Annex 1
Descriptive statistics for the sample of enterprises
Chart 19
Breakdown of enterprises by economic activity
(unweighted percentages)
Base: The figures refer to round 30 of the survey (January-March 2024).
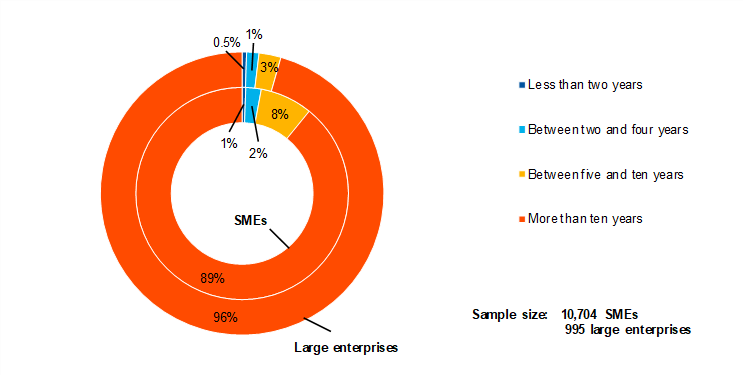
Chart 20
Breakdown of enterprises by age
(unweighted percentages)
Base: The figures refer to round 30 of the survey (January-March 2024).
Chart 21
Breakdown of enterprises by ownership
(unweighted percentages)

Base: The figures refer to round 30 of the survey (January-March 2024).
Chart 22
Breakdown of enterprises by exports
(unweighted percentages)
Base: The figures refer to round 30 of the survey (January-March 2024).
Annex 2
Methodological information on the survey
For an overview of how the survey was set up, the general characteristics of the euro area enterprises that participate in the survey and the changes introduced to the methodology and the questionnaire over time, see the “Methodological information on the survey and user guide for the anonymised micro dataset”, which is available on the ECB’s website.[12]
Starting from this round, a three-month reference period was applied in the questionnaire to half of the respondents, while the other half were asked about the usual six-month reference period. This affects questions Q0b, Q2, Q4, Q5, Q7A, Q7B, Q6A, Q11, Q9, Q10, Q23 and Q26.[13]
Two new questions on inflation expectations were added in this wave. One new quantitative question (Q31) asking the expected annual percentage change of inflation in (i) twelve months, (ii) three years, and (iii) five years. One new qualitative question (Q33) asking whether the risk to the outlook for inflation expectations in five years will be (i) a risk to the downside, (ii) risks are broadly balanced, or (iii) a risk to the upside.
© European Central Bank, 2024
Postal address 60640 Frankfurt am Main, Germany
Telephone +49 69 1344 0
Website www.ecb.europa.eu
All rights reserved. Reproduction for educational and non-commercial purposes is permitted provided that the source is acknowledged.
For specific terminology please refer to the ECB glossary (available in English only).
PDF ISSN 1831-9998, QB-AP-24-001-EN-N
HTML ISSN 1831-9998, QB-AP-24-001-EN-Q
This structure will be repeated in the third quarter of 2024 and the first quarter of 2025, while for the new additional survey rounds (covering the second and fourth quarters of 2024), firms will be asked to report changes in the previous three months only. This should help to improve comparability with the euro area bank lending survey (BLS) while maintaining the internal consistency and the time series of the SAFE.
In the new survey rounds, the sample will be smaller (up to 6,000 firms) and the financing-related part of the questionnaire will focus on bank-based finance and trade credit.See Annex 3 for details of methodological issues relating to the survey.
The net percentages indicated in this report are defined as the difference between the percentage of enterprises reporting that an indicator has increased and the percentage reporting that it has declined. Companies are not asked in any of the questions to provide answers adjusted for inflation (but are instead asked to provide answers in volume rather than value terms).
The indicator is derived from a factor analysis using firm-level survey replies since 2009. The variables included in the analysis cover changes in (i) price terms and conditions, (ii) non-price terms and conditions, (iii) the financial position of firms, and (iv) firms’ perceptions of changes in the willingness of banks to provide credit. This principal component is interpreted as relating to price terms and conditions. The analysis detects two other principal components, namely (i) the financial position of firms, and (ii) non-price terms and conditions. For a detailed description of the indicator, see the box entitled “Financing conditions through the lens of euro area companies”, Economic Bulletin, Issue 8, ECB, 2021.
Only those survey respondents which report that a particular financing instrument (i.e. bank loans, credit lines, trade credit, leasing or hire-purchase, debt securities, and equity or other loans) is relevant for their enterprise are asked about the availability of that source of financing.
Vulnerable firms are defined as firms that simultaneously report lower turnover, decreasing profits, higher interest expenses and a higher or unchanged debt-to-assets ratio, while financially resilient firms are those that simultaneously report higher turnover and profits, lower or no interest expenses and a lower or no debt-to-assets ratio. See the box entitled “Distressed and profitable firms: two new indicators on the financial position of enterprises”, Survey on the Access to Finance of Enterprises in the euro area, October 2017 to March 2018, ECB, June 2018.
The share of firms expecting non-positive price changes was 33% in this round, 24% in December 2023, 30% in September 2023, 22% in June 2023 and 17% in March 2023.
For ease of exposition, firms with unchanged profits were grouped with firms with increasing profits in this analysis.
To reflect statistical relationships at the current juncture, this analysis focuses on firm heterogeneity in the recent period Q1 2024 or the period from Q4 2023to Q1 2024. The heterogeneity is less strong in previous survey waves.
See Chart 10 in the main text for the change in firm profitability for different reference periods in this survey round.
In Chart B, the bars referring to “All firms” are based in part on firms that did not respond to the question on profits, which is the case for half of the firms in the total. This indicates that the average relationship is very close to the relationship for firms with decreasing profits.
The questionnaire is available on the ECB’s website. It has been translated into various languages for the purposes of the survey.
-
8 April 2024