
The impact of containment measures across sectors and countries during the COVID-19 pandemic
Published as part of the ECB Economic Bulletin, Issue 2/2021.
The measures enacted to contain the coronavirus (COVID-19) pandemic had a varied impact on economic activity across sectors and countries in the euro area in 2020. The bans on public events, strict lockdowns and restrictions on numerous activities in the spring of 2020 had a dramatic effect on the economy, with euro area GDP declining by 15% in the first half of the year. Since then, both public authorities and households and firms have learned how best to respond to more targeted containment measures to alleviate their economic impact. However, there is still significant uncertainty about the evolution of the pandemic, the containment measures and the associated economic effects. Against this background, this box explores the heterogenous economic impact of COVID-19 containment measures across sectors and across the five largest euro area countries, and also studies how this impact has changed over time.[1]
Activities requiring social interaction were the most heavily affected across all the euro area countries analysed. However, country-specific economic structures (sectoral composition and degree of openness), containment measures (subnational and cross-sector composition of policies), economic policy responses and institutional features contributed to significant cross-country heterogeneity in the observed economic losses in 2020 (Chart A).[2] Compared with the euro area aggregate, Germany and the Netherlands recorded smaller overall economic losses, as recreational services represent a smaller share of total real gross value added (GVA) in Germany (20% in 2019 compared with 22.5% for the euro area as a whole) and were less affected in both countries.[3] There were larger drops in activity in Spain and Italy, while France was broadly in line with the euro area aggregate. However, as the relatively large losses observed in Italy were also partly driven by foreign demand developments, the direct detrimental impact of containment was broadly comparable to the average for the euro area (as shown below).
Chart A
Economic losses by sector across the five largest euro area countries
(loss in real GVA in Q4 2020 as a percentage of the GVA level in Q4 2019)
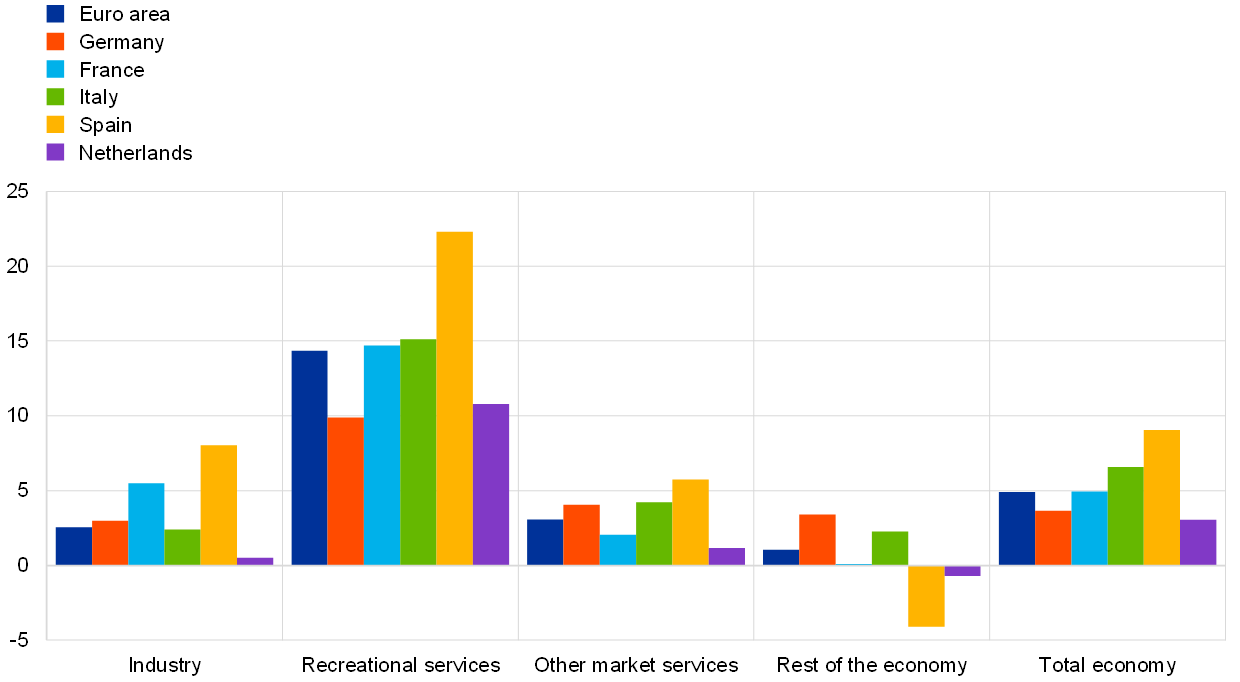
Sources: Eurostat, Hale, T. et al. (see footnote 4), Eurosystem and ECB calculations.
Note: Industry includes the NACE Rev. 2 classification sectors B, C, D, E and F; recreational services includes G, H, I, R, S, T and U; other market services includes J, K, L, M and N; rest of the economy includes A, O, P and Q; and total economy refers to real GDP.
We use a cross-sector vector autoregression (VAR) model to quantify the direct effects of the containment measures. A formal econometric approach is applied to sectoral data for the euro area and its five largest member countries. The econometric framework compares sectoral activity, measured by real GVA, with a proxy for the stringency of national containment measures – the Oxford Stringency Index (OSI) – which is comparable across countries.[4] To control for the different economic structures of euro area countries in terms of both production networks and degrees of openness, the model also links sectoral activity to a measure of country-specific foreign demand.[5] This allows us to identify the direct sector-specific impact of national containment policies while controlling for the effects of external factors, such as disruptions in global supply chains due to different sectors being more or less export-oriented.
The model accounts for the possibility of changes in the economic impact of COVID-19 containment measures over time. These changes stem from a process of learning, both for public authorities – as they adjust the composition of measures at subnational and sectoral level – and private households and firms – as they adapt to minimise economic losses. This box presents results based on estimated sector elasticities (both constant and time-varying), which enable us to ascertain the sensitivity of the total economy (real GDP) to the stringency of containment measures.[6] The evolution of the time-varying elasticities reflects the process of economic agents learning lessons over time, as well as the countervailing persistence of the scarring effects of restrictions.[7]
While domestic containment measures had a severe impact on recreational services, the retrenchment in manufacturing was largely driven by external factors. Recreational services, including trade, transport, accommodation, food activities, arts and entertainment, exhibit the highest (absolute) elasticities to OSI changes, indicating that they were the sectors most heavily hit by the containment measures (Chart B). While the initial lockdowns also affected production facilities, the average impact on manufacturing of the restrictions in 2020 was relatively small, as activity in this sector is, to a relatively large extent, driven by developments in foreign demand. Indeed, the high elasticity of manufacturing to foreign demand (not shown) reflects the sector’s high degree of openness to international trade. This hints at the additional cost of disruptions in global supply chains during the early phases of the pandemic and explains the strong recovery of the sector thereafter, as international trade rebounded in the second half of 2020. Finally, agriculture exhibits a negative elasticity and actually seems to have benefited from the restrictions, on average, possibly due to agricultural production processes requiring limited social interaction and being supported by sustained demand.
Chart B
Sector elasticities to the stringency of containment in the euro area
(impact of a 1-point decrease in Oxford Stringency Index (OSI) on real gross value added (GVA) quarter-on-quarter growth, percentage points)

Sources: Eurostat, Hale, T. et al., op. cit., Eurosystem, O*NET and ECB calculations.
Notes: The reported sector elasticities are estimated with the constant-parameter cross-sector VAR model. “Total” refers to real GDP.
Containment measures have particularly affected sectors with non-teleworkable, contact-intensive occupations. While the heterogeneity of the direct impact of restrictions could reflect various sector-specific characteristics, recent evidence suggests that social distancing measures have had a greater impact on sectors where there are less opportunities for remote work (i.e. non-teleworkable occupations). Among those sectors, activities with a higher frequency of in-person teamwork or face-to-face customer interaction (i.e. contact-intensive occupations) have been most affected.[8] This is confirmed by the positive correlation between the estimated sector elasticities and an index of non-teleworkable occupations (Chart C: blue dots), excluding agriculture, as well as the positive correlation between the same elasticities and an index of contact-intensive, non-teleworkable occupations (Chart C: yellow dots), including agriculture.[9]
Chart C
Correlation of sector elasticities with types of occupation in the euro area
(x-axis: sector elasticities, percentage points; y-axis: share of workers in non-teleworkable occupations or contact-intensive, non-teleworkable occupations, percentages)
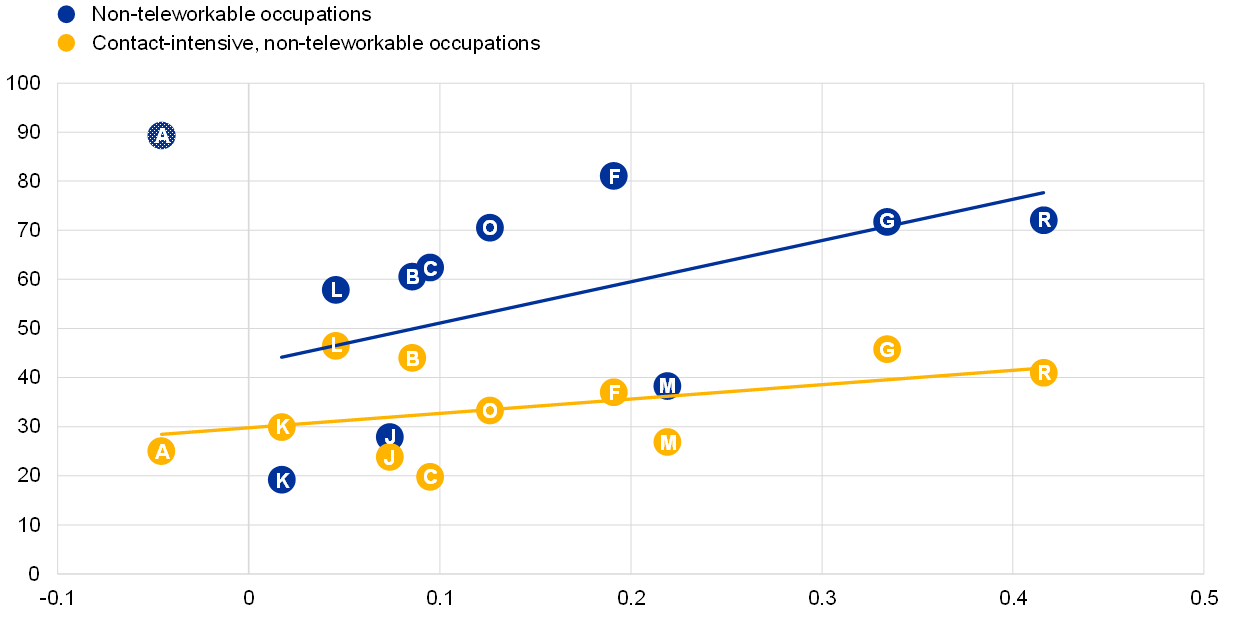
Sources: Eurostat, Hale, T. et al., op. cit., Eurosystem, O*NET and ECB calculations.
Notes: The reported sector elasticities are estimated with the constant-parameter cross-sector VAR model. One-letter labels refer to the following sectors: agriculture (A); other industry (B); manufacturing (C); construction (F); trade, transport, accommodation and food (G); information and communication (J); finance and insurance (K); real estate (L); professional and technical (M); public administration (O); and arts and entertainment (R). Granular data on occupations are based on the O*NET dataset (see O*NET OnLine, National Center for O*NET Development, 2020). The index of non-teleworkable occupations is constructed as 100 minus the index of teleworkable occupations in Dingel, J. and Neiman, B., op. cit. The index of contact-intensive, non-teleworkable occupations is produced by Koren, M. and Pető, R., op. cit., by combining an index of non-teleworkable occupations with a composite index of face-to-face teamwork, customer interactions, physical presence and communication. These granular data are aggregated into the 11 sectors based on value-added weights for NACE Rev. 2, two-digit level branches from the World Input-Output Database 2014 data for the euro area. The solid blue line corresponds to the trend between the sector elasticities and non-teleworkable occupations for all sectors excluding agriculture. The solid yellow line corresponds to the trend between the sector elasticities and contact-intensive, non-teleworkable occupations for all sectors.
The impact of containment measures has differed across countries and has changed over time, as economic agents have learned how to cope with restrictions. The estimated time-varying elasticities capture this change (Chart D). The rapid spread of the pandemic meant that these learning effects had little impact in the first half of 2020, as indicated by the strong increase in the sensitivity of activity in an environment of tightening restrictions. This was common across most sectors (Chart D, panel a), especially recreational services and industry (including manufacturing, construction and other industry), and most countries (Chart D, panel b), especially Spain. In contrast, these learning effects had a significant effect in the second half of 2020. In the third quarter, the elasticities strongly increased while restrictions loosened, allowing for a strong rebound in activity. The learning process strengthened further in the fourth quarter, as the elasticities fell sharply amid a renewed tightening of measures, alleviating the economic contraction. This effect was relatively strong in the industrial sector, as well as in Germany and the Netherlands. While there is strong evidence of learning over time, the model cannot determine whether the main factors behind this were more targeted (or localised) containment measures implemented by authorities or improved behavioural responses from households and firms.[10] Overall, while the levels of containment were largely comparable, the smaller economic losses in Germany and the Netherlands implied relatively small estimated elasticities, while the higher losses in Spain implied higher elasticities. The results also suggest that the average detrimental economic impact of containment in France and Italy in 2020 was broadly comparable to the estimated impact for the euro area as a whole.
Chart D
Estimated elasticities over time in the euro area
(impact of a 1-point decrease in OSI on real GVA quarter-on-quarter growth, percentage points)

Sources: Eurostat, Hale, T. et al., op. cit., Eurosystem and ECB calculations.
Note: “Total economy” refers to real GDP.
The recovery in economic activity is expected to remain heterogeneous across sectors during the first half of 2021, altering the composition of activity. The cross-sector VAR model can be used to break down the real GDP growth profile of the March 2021 ECB staff macroeconomic projections into sector-specific real GVA profiles (Chart E). These profiles reflect the historical cross-sector interactions and estimated elasticities, the assumed foreign demand and pandemic-related restrictions, and the assumed impact of containment measures in the future. According to these results, recreational services are set to bear the brunt of the pandemic over the short term, falling short of their pre-crisis level by around 10% by mid-2021. Other (non-recreational) market services are projected to remain below their pre-pandemic level by around 4%. In contrast, the industrial sector is projected to continue to fare well in the current phase of the pandemic and, by the second quarter of 2021, to exceed the level it had in the fourth quarter of 2019 by around 1%. Overall, these mechanical model-based extrapolations imply a continued reallocation of activity across market services, away from contact-intensive sectors and towards sectors less affected by social distancing and containment measures.
Chart E
Sector breakdown of real GDP in the euro area
(index, Q4 2019 = 100)
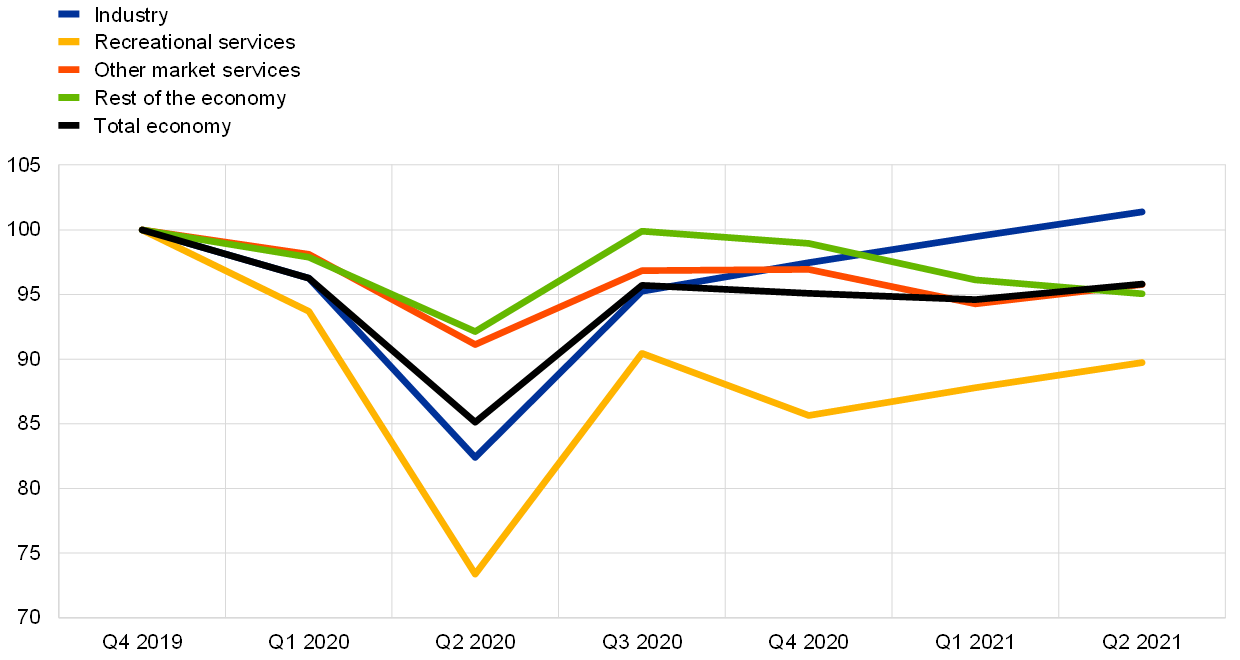
Sources: Eurostat, Hale, T. et al., op. cit., Eurosystem and ECB calculations.
Note: The model-implied sector developments are based on the March 2021 projections for real GDP and foreign demand in the first and second quarters of 2021.
To summarise, containing the COVID-19 pandemic has had a heterogenous economic impact across sectors and countries, and over time. Targeted containment measures and the behavioural responses of economic agents have helped limit the economic costs of restrictions. Looking forwards, the large divergence in the economic impact of containment measures across sectors is likely to persist, at least in the short term.
- The analysed sectors cover the whole economy, namely: agriculture (NACE Rev. 2 classification: A); other industry (B, D and E); manufacturing (C); construction (F); trade, transport, accommodation and food (G, H and I); information and communication (J); finance and insurance (K); real estate (L); professional and technical (M and N); public administration (O, P and Q); and arts and entertainment (R, S, T and U).
- For an overview of how the discretionary fiscal measures related to COVID-19 varied across countries, see the article entitled “The initial fiscal policy responses of euro area countries to the COVID-19 crisis”, Economic Bulletin, Issue 1, ECB, 2021. For an analysis of the impact of institutional features on the effectiveness of containment policies across countries, see “Lessons learnt or squandered? The evolving policy response and effectiveness of measures to deal with the pandemic”, Organisation for Economic Co-operation and Development, forthcoming.
- The smaller economic losses observed for recreational services in Germany and the Netherlands are due, among other factors, to the smaller negative effects from disruptions in international tourism for these two countries compared with other large euro area countries. See the box entitled “Developments in the tourism sector during the COVID-19 pandemic”, Economic Bulletin, Issue 8, ECB, 2020, and the box entitled “Impact of the COVID-19 lockdown on trade in travel services”, Economic Bulletin, Issue 4, ECB, 2020.
- See Hale, T., Angrist, N., Cameron-Blake, E., Hallas, L., Kira, B., Majumdar, S., Petherick, A., Phillips, T., Tatlow, H. and Webster, S., “Oxford COVID-19 Government Response Tracker,” Blavatnik School of Government, 2020. The aggregate euro area OSI is computed as a 2019 GDP-weighted average of the OSI for 18 euro area countries (information for Malta is not available). Each national OSI is a composite index summarising different containment and closure policies, such as school closures and restrictions on movement. The OSI is only available at national level and does not capture variations in containment measures across regions within a country.
- Country-specific foreign demand is derived based on a weighted average of the import volumes of trading partners and is a measure used in the ECB/Eurosystem staff macroeconomic projections. See the box entitled “The international environment”, ECB staff macroeconomic projections for the euro area, ECB, March 2021; “A guide to the Eurosystem/ECB staff macroeconomic projection exercises”, ECB, July 2016; and Hubrich, K. and Karlsson, T., “Trade consistency in the context of the Eurosystem projection exercises: an overview”, Occasional Paper Series, No 108, ECB, March 2010.
- The results for real GDP are obtained by weighting results for each sector with their respective share of total real GVA in the fourth quarter of 2019.
- The estimation is based on country and sector-specific data for real GVA from the first quarter of 1995 to the fourth quarter of 2020. Formally, the cross-sector VAR model, estimated separately for each country, can be represented as follows: where refers to the first-difference operator and denotes the vector of quarter-on-quarter growth rates of real sectoral GVA in quarter . The vector error term captures the residual aggregate economic effects that are influencing sectoral economic activity and are not directly related to containment measures or foreign demand. Moreover, is a vector of constant parameters referring to the average sector-specific real GVA growth rate, is a matrix of autoregressive parameters accounting for the intra- and inter-sectoral dynamics and refers to the vector of parameters for the constant or time-varying sector-specific elasticities with respect to the first differences of , i.e. economic impact. The path of the elasticities also captures the learning effects. The variables are the stringency of containment measures, proxied by the average OSI in quarter . Utilising the model over the forecast period requires assumptions about the future values of the OSI and the time-varying elasticities. After obtaining constant elasticity estimates with standard techniques, we use the Kalman filter to estimate the time-varying sensitivities, which are assumed to follow a random walk. The assumption that coefficients follow a random walk stochastic process is common in the macroeconomic literature. See, among others, the seminal contribution by King, R., Plosser, C., Stock, J. and Watson, M., “Stochastic Trends and Economic Fluctuations,” American Economic Review, Vol. 81, No 4, 1991, pp. 819-840.
- See Dingel, J. and Neiman, B., “How Many Jobs Can be Done at Home?”, Discussion Papers, No 14584, Centre for Economic Policy Research, April 2020; and Koren, M. and Pető, R., “Business disruptions from social distancing”, PLoS ONE, September 2020.
- Agriculture is a non-teleworkable occupation but is not contact-intensive, so it has been treated as an outlier for the first correlation.
- The behavioural responses include practices aimed at minimising disruptions to activity. These disruptions can be caused by voluntary social distancing in response to rising infections and delays in vaccinations, among other things. See also Chapter 2 in “World Economic Outlook,” International Monetary Fund, October 2020.