
Reflections on monetary policy
Keynote speech by Philip R. Lane, Member of the Executive Board of the ECB, at Bloomberg, London, 16 September 2019
I will divide this speech into two parts. First, I wish to review the current economic and financial environment. Second, I will discuss the monetary policy decisions taken by the Governing Council in last week’s meeting.[1]
The euro area economy
Incoming information is signalling a more extended slowdown in euro area growth dynamics than previously expected. As I will discuss, this slowdown is mainly due to external developments. While domestic demand is resilient, persistent uncertainties related to protectionist policies and geopolitical factors are taking a toll on economic sentiment and are clearly weighing on the euro area manufacturing sector.
On the international front, the latest survey data indicate that global activity remains subdued. This is the case in both emerging market and advanced economies, which suggests that a common factor is at play (Chart 1). The manufacturing sector has been affected most strongly, in particular for capital and intermediate goods, as well as for durable consumption goods. Since these goods are highly tradable, their production is sensitive to developments in international trade, which continues to be weak (Chart 2). Global trade and, consequently, euro area foreign demand have slowed substantially in recent quarters.
Composite output PMI
(diffusion index; seasonally adjusted; monthly data)

Sources: Markit and ECB staff calculations.Notes: The long-run averages are 53.0 for the euro area, 54.2 for advanced economies excluding the euro area and 53.1 for emerging market economies. Long-run average refers to the period from 1999 onwards for euro area and advanced economies and 2005 onwards for emerging market economies. Latest observation: July 2019.
Global merchandise import growth
(three-month-on-three-month percentage changes)

Sources: CPB and ECB staff calculations.Latest observation: June 2019.
One obvious source of weak trade dynamics is the uncertainty surrounding the international trading system, due to the rise of protectionism and geopolitical factors. Although the direct effects of individual tariff measures on economic activity have been contained, prolonged uncertainty and the prospect of an escalation of trade disputes are indirectly affecting the world economy by weighing on economic sentiment and global investment. Not only are protectionist measures a near-term headwind for the world economy, they can also give rise to allocative distortions that affect the level of potential output and the potential rate of productivity growth.
While these trade tensions are prominent, we should not ignore the fact that other factors are also affecting the manufacturing sector. Some emerging economies (including China) are rebalancing away from export-orientated manufacturing towards domestically-orientated services sectors. In addition, following an exceptionally strong performance in 2017, the global technology sector has started to cool (Chart 3).[2] Several key Asian economies specialise in tech production, with Asian tech exports accounting for 10 percent of global trade. These economies are closely linked to one another through integrated supply chains, such that the slowdown in tech production has affected economic activity in a number of countries.
The global tech cycle
(left-hand scale: diffusion index; right-hand scale: annual percentage changes)
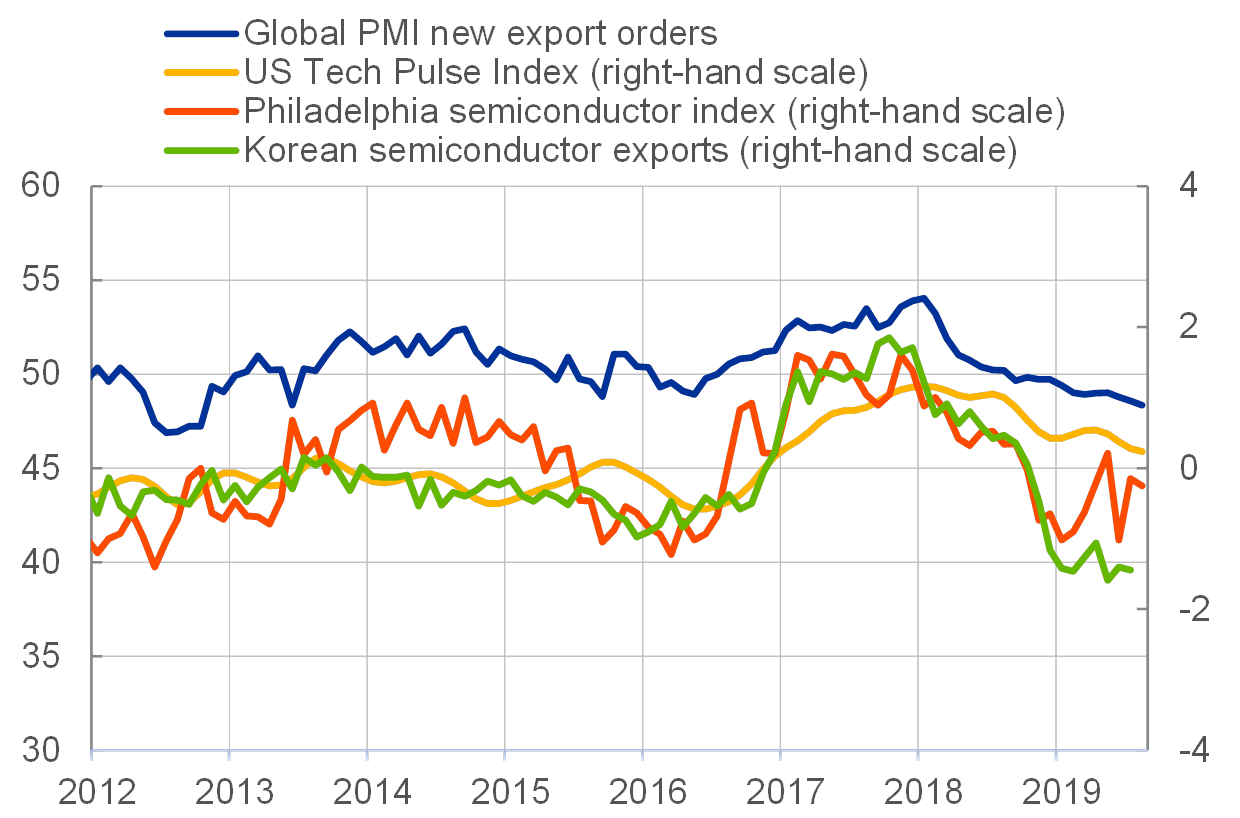
Sources: Tirpák, M. (2019), Markit, Thomson Financial Datastream, FRED, KITA and ECB calculations. Latest update: August 2019 (PMI, Philadelphia Semiconductor Index and US Tech Pulse Index) and July 2019 (Korean semiconductor exports).
Turning to the euro area, real GDP growth slowed from 0.4 percent, quarter on quarter, in the first quarter of this year, to 0.2 percent in the second quarter. This slowdown was due to a contraction of net exports, reflecting the weakness in the external environment, while domestic demand remained resilient.
Consumption is robust and households continue to signal optimism about their future financial situation (Chart 4). We expect positive consumption dynamics to continue to be supported by easy financing conditions, improving household balance sheets, higher disposable income on the back of fiscal stimulus, further - albeit slowing - employment gains, and rising labour income.
Retail trade and consumer confidence
(left-hand scale: year-on-year percentage changes of three-month average; right-hand scale: net percentages)

Sources: Eurostat, DG-ECFIN and ECB staff calculations.Latest observations: July 2019 for retail trade and August 2019 for consumer confidence.
The strength of employment growth has been a central feature of the euro area recovery in recent years and, so far, the labour market has been relatively resilient to the current slowdown. Employment is still increasing: the number of people employed has risen by 11.2 million since the employment trough in mid-2013. The unemployment rate stands at 7.5 percent, its lowest level since July 2008.
Despite some moderation, surveys such as the purchasing managers’ index (PMI) continue to signal positive overall employment growth in the third quarter. For the construction and services sectors, the PMI employment indices remain above their long-run averages, pointing to labour market resilience in sectors less exposed to trade tensions. However, in the more externally-oriented manufacturing sector, employment indicators have been in contractionary territory for four months, illustrating that the euro area labour market is not immune to global developments (Chart 5).
PMI indicator of employment in the euro area
(index level)

Source: Markit.Latest observations in Q2 2019: sector-specific averages of the values in July and August.
The continued threat of protectionism and other geopolitical risks, such as the possibility of a disorderly Brexit, are clearly weighing on confidence. Business investment has been slowing down since early 2018 and was relatively subdued in the first half of this year. The negative effects of persistent uncertainties on the euro area economy are especially evident in the manufacturing sector, which is most exposed to trade developments.
Let me elaborate on the contrast between developments in the manufacturing and services sectors, which is evident in activity, confidence, employment and price data. The manufacturing sector has been underperforming the more domestically oriented services sector since 2018 (Chart 6). The PMI manufacturing output index has been in contractionary territory for seven consecutive months, decreasing to 47.4 in the first two months of the third quarter, compared with an average of 48.5 in the second quarter. By contrast, the services PMI remains in expansionary territory and has edged higher, on average, in the third quarter to date, when compared with the previous quarter. So the gap between weak manufacturing and resilient services activity has further widened.
Euro area PMI indices
(diffusion index; 50 = no change)

Source: Markit.Latest observation: August 2019.
While the services sector contributes over 70 percent of total value added in the euro area, the extended weakness in manufacturing is weighing considerably on overall activity levels. In addition to its adverse impact at the aggregate level, the slowdown in manufacturing has an asymmetric effect across member countries and different sectors. For example, while Germany accounts for 28 percent of euro area GDP, its contribution to euro area manufacturing value added stands at 39 percent. By contrast, France represents 21 percent of euro area GDP but only 13 percent of manufacturing.[3] Comparing national business climate indicators shows a relatively pronounced deterioration of sentiment in Germany, where the Ifo index for manufacturing has fallen to its lowest level since December 2009 (Chart 7).
National manufacturing business climate indicators
(difference from long-term average; normalised)

Sources: Ifo, Insee and Istat.Latest observation: August 2019.
Although the euro area services sector remains resilient, there is no room for complacency: the longer the weakness in manufacturing persists, the greater the risk of adverse spillovers to other sectors of the economy. In Germany, for example, service providers reported in August noticeably less optimistic expectations for the near future, and have become more pessimistic in their assessment of the current business situation. Possible knock-on effects from anaemic industrial activity to other sectors of the economy therefore need to be closely monitored.
As a result of continued global uncertainties and their impact on confidence, the short-term growth outlook has been revised down in the latest ECB staff macroeconomic projections. Real GDP growth is now projected to be 1.1 percent in 2019, 1.2 percent in 2020 and 1.4 percent in 2021. Compared with the June Eurosystem staff projections, growth for this year was revised down by 0.1 percentage points, and for next year by 0.2 percentage points. Notwithstanding the downward revisions to the growth outlook, the balance of risks remains tilted to the downside. Furthermore, I would characterise the distribution of risks as bimodal. In one scenario, global trade tensions and Brexit could be resolved positively, while in another scenario, trade-related uncertainty could linger and risks associated with a disorderly Brexit could materialise.
HICP and HICP excluding food and energy
(percentages per annum)

Sources: Eurostat and ECB calculations.Notes: HICP stands for harmonised index of consumer prices. Based on monthly observations.Latest observation: August 2019 (flash estimate).
Turning to nominal developments, inflation continues to fall short of expectations (Chart 8). Headline inflation remains well below our inflation aim, while core inflation has been hovering around 1 percent for an extended period of time. At one level, the reduction in labour market slack is translating into higher compensation per employee (Chart 9)[4]. However, the pass-through of higher wages to domestic price pressures remains muted, it follows that firms are absorbing higher unit labour costs through lower profit margins (Chart 10).
While the reasons for this limited pass-through have yet to be fully explained, a contributing factor is the weakness in the manufacturing sector, as reflected by weaker supply chain price pressures compared with the services sector. The European Commission’s indicators of three-months-ahead selling price expectations show that they have deteriorated in the manufacturing sector but have held up well in the services sector (Chart 11).
Phillips Curve-based decomposition of wage growth into its main drivers
(deviations from mean in year-on-year growth terms and percentage point contributions)

Source: Nickel, C. et al. (eds.) (2019) “Understanding low wage growth in the euro area and European countries”, Occasional Paper Series, No 232, ECB.Notes: Sample from Q1 1995 to Q4 2018. The blue line shows deviations of compensation per employee growth from its model-implied mean. Contributions (including residuals) are also shown as deviations from their model-implied mean. Contributions are derived as in Yellen, J.L. (2015). “Inflation Dynamics and Monetary Policy”, speech at the Philip Gamble Memorial Lecture, University of Massachusetts, Amherst.Latest observation: Q4 2018.
GDP deflator and contributions
Share of countries with short-term selling price expectations below long-term mean
(percentages)

Sources: European Commission and ECB staff calculations. Notes: Selling price expectations in manufacturing for three months ahead based on a European Commission indicator available since 1999 for all euro area countries (except Luxembourg). The series are shown as two-month moving averages.Latest observation: August 2019.
Meanwhile, market-based indicators of future inflation outcomes have stagnated at historical lows. For instance, although the likelihood of deflation remains limited, the market assessment of the probability of low inflation over the next five years, as derived from options prices, has increased substantially since the turn of the year (Chart 12).
Option-implied distribution of average inflation over the next five years
(percentages)

Sources: Bloomberg, Thomson Reuters and ECB staff calculations.Notes: Probabilities implied by five-year zero-coupon inflation options, smoothed over five business days. Risk-neutral probabilities may differ significantly from physical, or true, probabilities.Latest observation: 12 September 2019.
The ECB staff projections published last week now point to headline inflation of 1.2 percent in 2019, 1.0 percent in 2020 and 1.5 percent in 2021. Compared with the June projections, the profile for headline inflation has been revised down by 0.1 percentage points in 2019 and 2021, and by 0.4 percentage points in 2020. Although the downward revisions to headline inflation are partly due to the volatile energy component, projections for HICP inflation excluding food and energy have also been revised down on account of weaker data outturns, softer activity, indirect effects from lower energy prices and persistent past over-predictions.
Last week’s policy meeting also took place against the background of a pronounced fall in risk-free rates that we have been observing since the start of the year. In part, this is a global pattern, with US long-term yields also declining (Chart 13). This suggests that there is a substantial shared component in the decline in long-term rates that reflects a significant weight being attached to sub-par long-term outcomes for growth and inflation across advanced economies.
Ten-year yields of German and US government bonds
(percentages)

Sources: Bloomberg and ECB.Latest observation: 10 September 2019.
The downward revision in long-term yields incorporates the market’s assessment that central banks will respond (both in the near term and the long term) to adverse developments in the inflation outlook by lowering policy rates and further contributing to the easing of financial conditions through the compression of term premia (Chart 14). While the lower rates that we have observed have contributed to an overall loosening of financial conditions since the start of the year, it is important to keep in mind that long-term rates that are declining due to a deterioration of the economic outlook, an adverse shift in the risk distribution or revised calculations of the equilibrium real interest rate offer only limited easing potential, especially if they are not backed up by active use of the policy toolkit.[5]
Realised EONIA and forward curve
(percentages per annum)

Source: ECB.
Monetary policy
At our meeting last week, the Governing Council was hence confronted with a more extended slowdown of the euro area economy than previously anticipated, persistent and salient downside risks to the growth outlook, and a further delay in the convergence of inflation towards our medium-term inflation aim (Chart 15). The case for a monetary policy response was clear, and a comprehensive package of measures was judged to be the most effective way to support the convergence of inflation to our aim.[6]
Actual and projected HICP inflation
(year-on-year percentage change)

Source: ECB and Eurosystem staff macroeconomic projections.
The policy response to the continued shortfall of inflation from our aim also reflects our commitment to symmetry in the inflation aim, which we emphasised in the statement following the Governing Council’s July meeting. This was essentially a clarification of our reaction function: our determination to act when inflation falls short of our medium-term inflation aim is just as strong as our determination to act when inflation exceeds that aim. Stating clearly our commitment to symmetry is important, since the formulation of our aim – “below, but close to, 2 percent” – risks being misunderstood, particularly in an environment of falling inflation expectations. We also stressed in July that both realised and projected inflation have been persistently below levels that are in line with our aim. This was also an important facet of our communication because the “close to” formulation of our inflation aim does not provide a precise numeric anchor for inflation expectations.
In line with our commitment to symmetry, the downward revisions to the projected inflation path warranted a vigorous policy response. We therefore announced a broad-based set of measures designed to complement each other in providing monetary stimulus. Our measures will lock in financial conditions across various segments of the market that are sufficiently supportive to foster a reacceleration of growth and the anchoring of inflation expectations. Favourable financing conditions will pass through to the borrowing costs of businesses and households, which will sustain investment and consumption. Greater business and household expenditure, in turn, is one key condition for inflation to converge to our aim. In addition, our policies create a cushion to insulate the economy from the materialisation of downside risks by reducing uncertainty about future financing conditions and underpinning confidence.
Let me first outline our adjustments to the instruments that primarily affect the expected path of short-term interest rates and thereby the expectations component of long-term interest rates: the level of the key policy rates and forward guidance on the expected path of these rates.
We decided to lower the interest rate on the deposit facility by 10 basis points to -0.5 percent. In the context of ample excess liquidity, the deposit facility rate is the anchor for the EONIA market interest rate – which is the starting point of the monetary policy transmission mechanism. The EONIA anchors the overnight indexed swap curve in the euro area, which in turn underlies the pricing of many financial instruments and, in particular, underpins the reference rates that are important for loan rate fixation. Lowering the deposit facility rate therefore affects the entire term structure of interest rates and, ultimately, the funding costs that matter for businesses and households. Negative rates have supported the portfolio rebalancing channel of the asset purchase programme (APP) by encouraging banks to lend to the broad economy instead of holding onto liquidity.[7] The impact of the cut in the deposit facility rate on the term structure of interest rates is reinforced by our forward guidance, which now strengthens the conditionality criteria for interest rate normalisation.
We strengthened our state-contingent forward guidance in a number of ways. These enhancements complement our emphasis on symmetry by clarifying our reaction function with respect to developments in the inflation outlook: the strengthened guidance provides a clear signpost for rate expectations by linking our policy to more stringent conditions for the inflation outlook. Specifically, the guidance now gives a clearer indication of what we want to see before policy interest rates start to normalise. As communicated last week, we expect to keep the key ECB interest rates at present or lower levels until we have seen the inflation outlook robustly converge to a level sufficiently close to, but below, 2 percent within our projection horizon, and such convergence has been consistently reflected in underlying inflation dynamics.
This formulation provides a conditionality framework with a number of elements. First, we want to see inflation rising to a level that is sufficiently close to, but below, 2 percent. This reflects our communication in July: realised and projected inflation are too low relative to our aim. Second, we have preserved the forward-looking formulation of our forward guidance, since the guidance has a medium-term orientation. This reflects the general principle that monetary policy takes time to display its full effects and thus should be forward-looking. Third, we have added two safeguards to anchor the notion of sustainability, which has always been part of our guidance but is now more clearly stated. The phrase “robustly converge” means that the Governing Council wants to be sure that the process of convergence is sufficiently mature and realistic before starting to lift policy rates. The qualification that convergence needs to be “consistently reflected in underlying inflation dynamics” means that the trajectory of realised inflation should underpin our inflation outlook.
State-contingent forward guidance is especially effective under conditions of elevated uncertainty since it facilitates a smooth adjustment to the evolution of macroeconomic and financial conditions in both directions: expectations about the future policy path will respond in a stabilising manner to the emergence of positive or negative news.
We also retained the so-called easing bias by stating our expectation to keep the key ECB interest rates “at present or lower” levels. We judge that, if needed, we can further lower the deposit facility rate and, with it, the overnight money market rate. As a result, there is no reason for the distribution of future short-term rate expectations to be skewed upwards.[8] Finally, we dropped the date-based leg of our forward guidance since the strengthened state-contingent information, which links our policy more tightly to the inflation outlook, provides sufficient guidance to markets on the future path of monetary policy.
We also decided to restart net asset purchases at a monthly pace of €20 billion as from the beginning of November. Our purchases are expected to run for as long as necessary to reinforce the accommodative impact of our policy rates, and to end shortly before we start raising the key ECB interest rates. In addition, we reiterated our intention to continue reinvesting, in full, maturing principals for an extended period of time past the date when we start raising the key ECB interest rates, and in any case for as long as necessary to maintain favourable liquidity conditions and an ample degree of monetary accommodation. Renewed net asset purchases and the revised forward guidance on policy rates also imply an expansion of the reinvestment envelope and the automatic response of the reinvestment horizon to the evolution of the inflation outlook. Finally, based on our projections on the size and evolution of the purchasable universe, we are confident that the envisaged purchase volumes will be consistent with the current parameters of the APP for an extended period of time.
Additional net asset purchases and, by implication, the revised reinvestment horizon reinforce the accommodative impact of our policy rates in several ways. First, by affecting term premia, net purchases and reinvestment complement the downward impact on long-term interest rates exerted by our policy rate forward guidance. The APP therefore provides further support to the funding costs that matter for businesses and households. Second, asset purchases entail a signalling channel by demonstrating our commitment to use all instruments in pursuit of our aim. This not only influences the expected path of short-term policy rates, and thereby long-term interest rates, it can also have a powerful effect on the formation of inflation expectations. Third, the APP entails wealth effects on the balance sheets of banks and other entities, providing further impetus to investment and consumption.
Fourth, new net purchases and a prolonged reinvestment horizon mitigate the passive tightening in the monetary policy stance that happens mechanically as the APP portfolio ages. One of the channels through which asset purchases work is the duration channel. By absorbing duration risk from the market, the APP reduces the risk compensation required by investors, which puts downward pressure on term premia and yields. As the bonds we hold in our portfolio come closer to maturing, however, the overall amount of duration risk that is tied up in our portfolio progressively falls. As a result, the downward impact on risk premia – and thereby on long-term interest rates – resulting from the duration channel weakens over time. Adding to the stock of asset purchases – both directly and through the reinvestment channel – will keep this portfolio ageing effect at bay (Chart 16).[9]
Estimated effect of APP recalibration vintages on euro area ten-year term premium
(basis points)
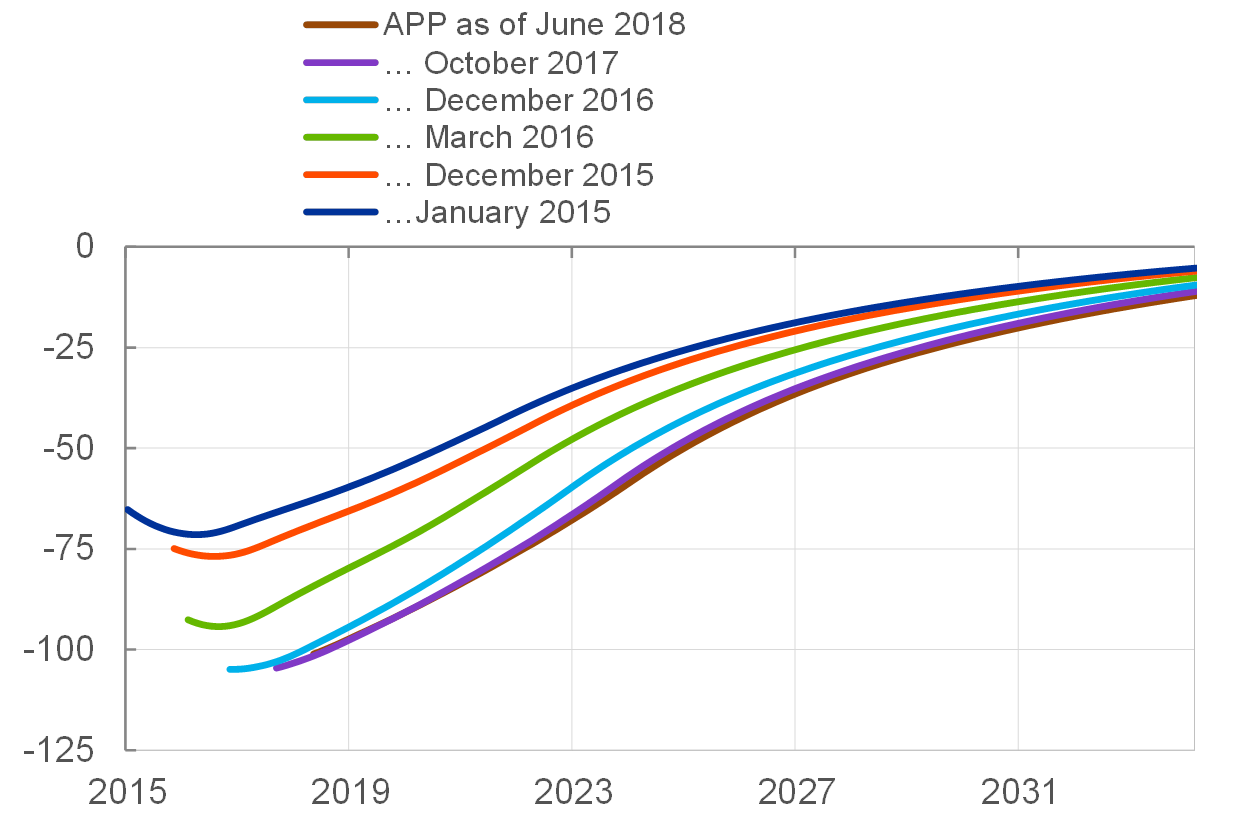
Source: Based on Eser, F., Lemke, W., Nyholm, K., Radde, S. and Vladu, A.L. (2019), “Tracing the impact of the ECB’s asset purchase programme on the yield curve”, Working Paper Series, No 2293, ECB.Notes: The chart shows the impact of the APP through the duration channel on the term premium component of the ten-year sovereign bond yield (averaged across the four largest euro area countries) over the events cited in the chart legend. The reinvestment horizon is assumed to be five years starting in the month after the announced end of net purchases at each point in time. The chart does not account for the new asset purchases announced in September 2019.
To ensure the continued smooth transmission of our monetary policy stance, we decided to adjust the parameters of the new series of targeted longer-term refinancing operations (TLTRO III) and announce a two-tier system for reserve remuneration. Both measures serve to mitigate the risk of possible side effects of the ECB’s accommodative monetary policy stance on bank-based intermediation undermining the sustained convergence of inflation.
With respect to the TLTROs, we eliminated the 10 basis point spread over the key policy rates entailed in the initial pricing of the operations. The interest rate in each operation will now be set at the level of the average rate applied in the main refinancing operations over the life of the respective TLTRO. For banks whose eligible net lending exceeds a benchmark, the rate applied in the TLTRO III operation will be lower, and can be as low as the average interest rate on the deposit facility prevailing over the life of the operation. In addition, the maturity of the operations will be extended from two to three years.
These changes will not only ensure the smooth transmission of monetary policy, they will also preserve favourable bank lending conditions and support the accommodative stance of monetary policy. In particular, extending the maturity from two to three years will better align the operations with the typical maturity of bank-based financing of investment projects, thereby enhancing the support that TLTRO III provides to the financing of the real economy. The adjustments to the TLTRO III parameters signal that the Governing Council can act in an agile manner and fine-tune its monetary policy instruments, as needed, to ensure that they are efficient, effective and proportionate to the risks to price stability.
Complementing the TLTRO III operations, the two-tier system for reserve remuneration – which will take effect on 30 October 2019 – supports the bank-based transmission mechanism, as it will mitigate the adverse side effects of negative interest rates on banks. This system has been calibrated to strike a balance between, on the one hand, offsetting the direct cost of negative interest rates on bank profitability, thereby helping to sustain the pass-through of low policy rates to bank lending rates, and on the other, preserving the positive contribution of negative rates to the accommodative stance of monetary policy and the continued sustained convergence of inflation to our aim.
Reconciling these two goals is possible, since the value of funds in the money market is determined by their cost at the margin. That marginal cost will continue to be set by the rate on our deposit facility, and it will not be influenced by the higher remuneration that banks will receive on the portion of their reserves that will be exempt under the new scheme. The excess liquidity that will be created in exchange for the additional bond purchases that start in November will also further increase the non-exempt amount, which has already been calibrated in such a way as to preserve a high level of trading activity in the money market. In any case, we will actively monitor conditions in the money market and adjust parameters as necessary to maintain an active trading environment and to ensure that the easing effects of a reduction in the overnight interest rate are transmitted effectively through the entire yield curve.
To sum up, the measures we announced last week complement each other and together constitute a powerful package. As I previously noted, the evidence shows that our monetary policy measures have been an effective response to the environment that the ECB has faced in recent years.[10] The cut in the deposit facility rate lowers the anchor for the entire term structure of interest rates, while the forward guidance on interest rates steers expectations of the short-term interest rate path. The forward guidance protects the short to medium-term segment of the yield curve from unnecessary volatility by eliminating residual uncertainty about the expected rate path over the forward guidance horizon. In addition, it helps to steer the long end of the yield curve by affecting the expectations component of long-term interest rates.
Renewed net asset purchases reinforce the downward pressure on long-term rates by reducing risk premia, and also complement the impact of forward guidance on the expected short-term rate path by signalling the Governing Council’s commitment to maintain a highly accommodative monetary policy stance for a prolonged period of time. New net asset purchases will also mitigate the mechanical upward pressure on long-term rates that ensues from the gradual ageing of our portfolio and the associated loss of duration. Both the net asset purchase horizon and the reinvestment horizon are linked to our interest rates. They will therefore adjust dynamically to changes in the inflation outlook and work in the background to keep a lid on medium to long-term interest rates. Meanwhile, the changes in the TLTRO III parameters and the two-tier system for reserve remuneration will ensure that lower market interest rates are effectively passed through to the interest rates banks charge their customers.
Concluding remarks
The convergence of inflation towards the Governing Council’s aim has recently slowed and partly reversed. The comprehensive package of measures decided last week will help to support the convergence of inflation to levels that are below, but close to, 2 percent in a sustained manner. Our policy decisions will affect inflation by supporting favourable financing conditions, and thereby growth, as well as by underpinning inflation expectations. It is clear that a highly accommodative stance of monetary policy will be necessary for a prolonged period of time. Forward guidance on the key ECB policy rates is a very powerful instrument and remains our principal tool, together with the level of our key policy rates, for adjusting the monetary policy stance. The asset purchase programme is an important complement to our interest rate policy and will dynamically adjust in line with our policy rate forward guidance.
Backed by our assessment of the empirical evidence, we are confident that our monetary policy measures remain effective in fostering a reacceleration of growth and, thereby, inflation convergence, and we are determined to adjust all of our instruments, as appropriate, to ensure that inflation converges durably to our aim, in line with our commitment to symmetry. The ECB’s mandate for price stability is unconditional, and the Governing Council is unwavering in its commitment to achieve its inflation aim.
Finally, as I have outlined today, our monetary policy decisions are driven by our assessment of the macroeconomic and financial environment. As noted in last week’s introductory statement, other policy pillars play a critical role in determining the long-term and short-term prospects for the euro area economy. Growth-enhancing institutional and structural reforms and a more growth-friendly composition of public finances can play important roles in boosting the long-run potential of the euro area economy. At the cyclical level, fiscal policy can contain the impact of adverse shocks through the operation of automatic stabilisers and, where feasible and effective, through the timing of discretionary fiscal measures. All else being equal, the more fiscal policy contributes to boosting long-term growth potential and providing cyclical stabilisation, the quicker will be the effects of monetary policy interventions on inflation and the economy.
After the procyclical tightening of the aggregate fiscal stance in response to the euro area sovereign debt crisis, and a neutral stance during the economic upswing, the current mildly expansionary euro area fiscal stance is providing some support to economic activity (Charts 17 and 18).
Euro area fiscal stance and change in output gap
(percentage points)
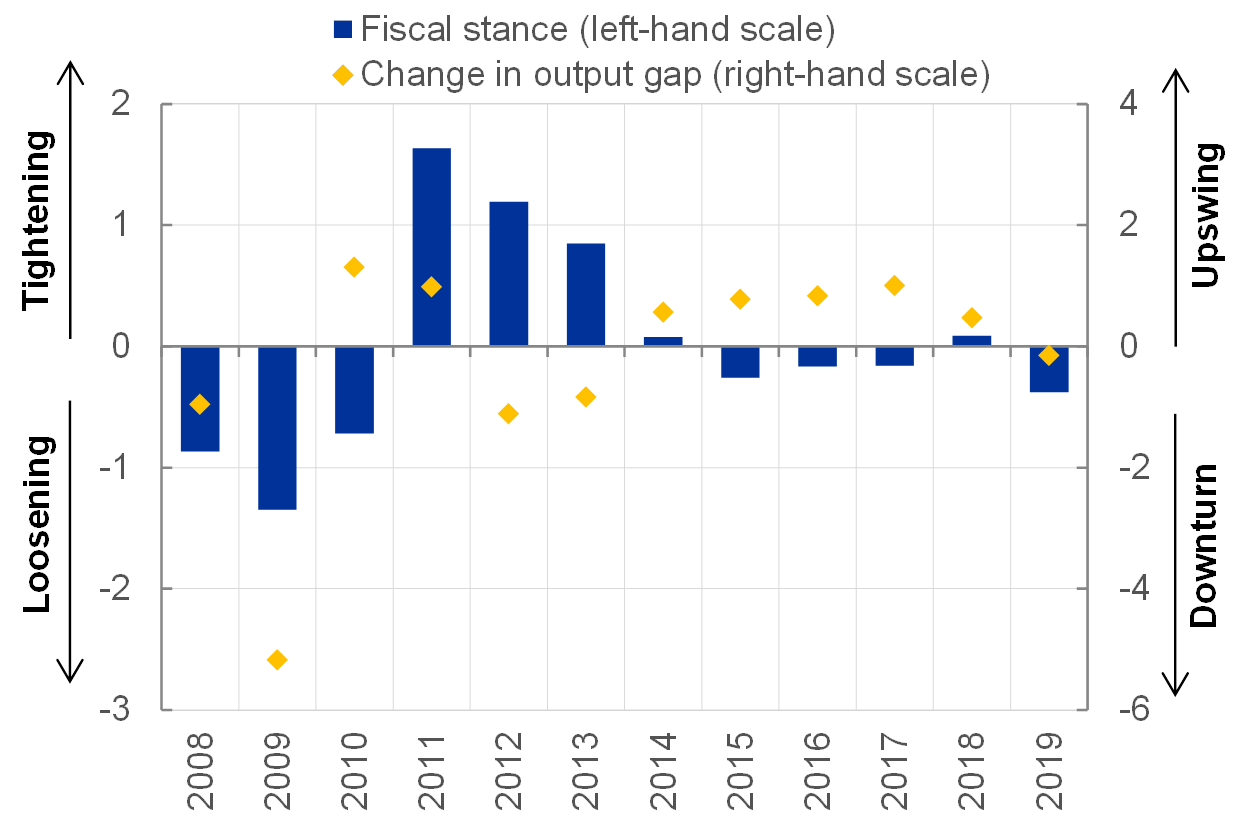
Source: AMECO database (European Commission spring forecast). Note: The fiscal stance is approximated by a change in the ratio to GDP of the cyclically adjusted government balance.
Contributions to euro area real GDP growth
(annual GDP growth in percentages; contributions in percentage points)

Source: September 2019 ECB staff macroeconomic projections.
In view of the weakening economic outlook and the continued prominence of downside risks, governments with fiscal space that are facing a slowdown should act in an effective and timely manner. Where fiscal sustainability is ensured, the potential effectiveness of countercyclical fiscal policy is reinforced in the current environment, given that fiscal multipliers are higher in a low interest rate environment. At the same time, governments in countries with high public debt should pursue prudent policies and deliver on structural balance targets.
- [1]I would like to thank Danielle Kedan for her contribution to this speech.
- [2]See Tirpák, M. (2019), “What the maturing tech cycle signals for the global economy”, Economic Bulletin, Issue 3, ECB.
- [3]Italy’s contributions to euro area GDP and manufacturing amount to around 15 percent each, while Spain makes up 11 percent of GDP and 9 percent of manufacturing value added.
- [4]For a detailed analysis of euro area wage developments, see Nickel, C. et al. (eds.) (2019) “Understanding low wage growth in the euro area and European countries”, Occasional Paper Series, No 232, ECB.
- [5]The recent Jackson Hole paper by Jordà, O. and Taylor, A.M. (2019) provides an analysis of the inter-relationships between long-term rates, short-term policy rates, macroeconomic variables and the measurement of the policy stance.
- [6]For an empirical review of the effectiveness of the different elements of the ECB’s monetary policy toolkit and the sources of complementarities across these instruments see my recent speech “Monetary Policy and Below-Target Inflation”, Bank of Finland conference on Monetary Policy and Future of EMU, 2 July.
- [7]See Ryan, E. and Whelan, K. (2019), “Quantitative Easing and the Hot Potato Effect: Evidence from Euro Area Banks”, Research Technical Paper, No 1, Vol 2019, Central Bank of Ireland; and Demiralp, S., Eisenschmidt, J. and Vlassopoulos, T. (2019), “Negative interest rates, excess liquidity and retail deposits: banks’ reaction to unconventional monetary policy in the euro area”, Working Paper Series, No 2283, ECB.
- [8]For further discussion, see my recent speech “Monetary Policy and Below-Target Inflation”, Bank of Finland conference on Monetary Policy and Future of EMU, 2 July.
- [9]For further discussion, see ECB (2019), “Taking stock of the Eurosystem’s asset purchase programme after the end of net asset purchases”, Economic Bulletin, Issue 2.
- [10] For further discussion, see my recent speech “Monetary Policy and Below-Target Inflation”, Bank of Finland conference on Monetary Policy and Future of EMU, 2 July.
European Central Bank
Directorate General Communications
- Sonnemannstrasse 20
- 60314 Frankfurt am Main, Germany
- +49 69 1344 7455
- media@ecb.europa.eu
Reproduction is permitted provided that the source is acknowledged.
Media contacts