


Assessing risks from euro area banks’ maturity transformation
Assessing risks from euro area banks’ maturity transformation
Published as part of the Financial Stability Review, November 2023.
This special feature builds on the concept of maturity gap as a metric of banks’ maturity mismatch to shed light on how banks’ engagement in maturity transformation differs across euro area countries and bank types. Banks can mitigate the interest rate risk stemming from their maturity mismatch by using derivatives for hedging purposes. Euro area banks increased their positions in interest rate derivatives over the last two years in anticipation of the start of monetary policy normalisation. Significant institutions rely more than cooperative and savings banks on interest rate derivatives and have a more diversified positioning. The extent of banks’ maturity mismatch determines the sensitivity of their net interest income to changes in interest rates and the slope of the yield curve. This special feature provides empirical evidence that the more banks engage in maturity transformation the more their net interest margin benefits from a steepening of the yield curve, boosting bank profits. This effect might dissipate going forward, especially for banks in countries where variable-rate lending predominates.
1 Introduction
Engaging in maturity transformation exposes banks to interest rate risk: the potential negative impact on their earnings or capital that could arise from adverse changes in interest rates.[1] The failure of Silicon Valley Bank in the United States in March 2023 illustrates the possible challenges banks can face following a swift and material rise in interest rates. This is especially the case when compounded by weak risk management practices and business models that feature a high share of long-term assets and rely largely on uninsured deposits.
This special feature builds on the maturity gap, a metric of banks’ maturity mismatch, to explore the role of maturity transformation for banks. It first examines how banks’ maturity gaps change over time and across bank types before going on to discuss the role that interest rate derivatives can play in mitigating the interest rate risk stemming from maturity mismatch. Finally, it investigates the implications of the maturity gap for banks’ net interest margins (NIMs).
2 Maturity transformation and interest rate risk
Banks’ engagement in maturity transformation can be measured by the maturity gap. The maturity gap captures the difference between the repricing period for bank assets and bank liabilities. Due to data availability constraints, in this special feature the maturity gap is approximated by the difference between the weighted average repricing period for loans to the non-financial private sector and the weighted average repricing period for deposits from the non-financial private sector, based on new business volumes.[2] A positive maturity gap indicates that loan repricing occurs over a longer timespan than deposit repricing. This measure makes it possible to analyse the relations between banks’ balance sheet structures and interest rate developments, and the implications for profitability.
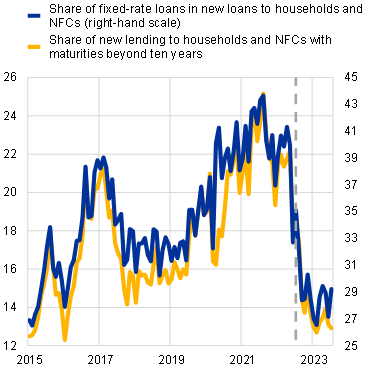
The aggregate maturity gap of euro area banks has decreased during the recent rate-hiking cycle. During the period of ultra-low interest rates which ran from 2014 to 2021, the average time for loans to reprice increased gradually (Chart A.1, panel a) as the share of fixed-rate lending rose (Chart A.1, panel b). Banks had an incentive to earn the larger term premium associated with longer maturities to partially offset margin compression and the related drop in profitability. Also, customers preferred to borrow at fixed rates with a view to locking in very low rates for a longer period. At the same time, there was a decline in the average time for deposits to reprice on account of the shift from term deposits to overnight deposits.[3] As a result, the average maturity gap rose to about 35 months as at the end of the last quarter of 2021 (Chart A.1, panel a). This trend then reversed as expectations of monetary policy tightening began to materialise. The decrease in the maturity gap was driven by a reduction in loan repricing time, caused by a drop in the share of fixed-rate lending, as well as an increase in deposit repricing time. The latter was caused by a shift from overnight deposits to term deposits on the back of the higher remuneration provided by the latter when rates are rising.
Chart A.1
The growing share of variable-rate assets and term deposits has led to a decrease in the maturity gaps of euro area banks since the start of the hiking cycle in mid-2022
a) Maturity gap and time for loans and deposits to reprice | b) Characteristics of lending to households for house purchase and NFCs |
|---|---|
(Q1 2011-Q2 2023, months) | (Jan. 2015-July 2023, percentages) |
 |  |
Sources: ECB (iMIR, MIR) and ECB calculations.
Notes: The dashed grey lines mark the start of the hiking cycle in July 2022. Panel a: based on an unbalanced sample of 330 monetary financial institutions (MFIs, consolidated). The lines represent the median in each quarter. Panel b: loans include new lending for house purchase (households) and new loans other than revolving loans and overdrafts, convenience and credit card debt extended to non-financial corporations (NFCs).
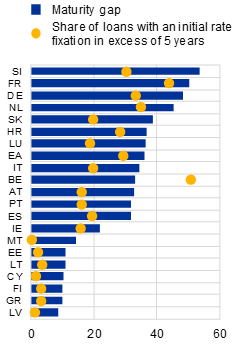
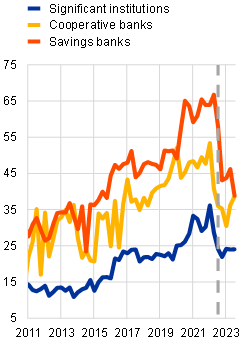
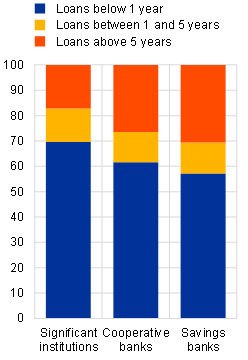
Banks’ maturity gaps differ across countries and bank types due to differences in interest rate fixation conventions and business model characteristics. In terms of their maturity gaps, banks domiciled in euro area countries can be clustered into three groups: around ten months, about 30 months and above 40 months (Chart A.2, panel a). The gap is higher in countries where banks have a larger share of long-term, fixed-rate loans. Typically, long-term loans originated at a fixed rate have a higher duration and are therefore more sensitive to interest rate risk. When it comes to bank types, cooperative banks and savings banks are more active in maturity transformation (Chart A.2, panel b), given their focus on traditional banking activities with a greater share of long-term loans to households and NFCs (Chart A.2, panel c).[4] By contrast, significant institutions’ more diversified business models have a narrower maturity gap (Chart A.2, panel b), mainly because they carry a lower share of long-term loans on their balance sheets.
Chart A.2
Banks’ maturity gaps vary across euro area countries and banks’ business models
a) Average maturity gap and share of long-term loans across the euro area | b) Median maturity gap, by bank type | c) Breakdown of the loan book by average time to reprice and bank type |
|---|---|---|
(Q2 2023, months, percentages) | (Q1 2011-Q3 2023, months) | (Q2 2023, percentages) |
 |  |  |
Sources: ECB (iMIR), BvD Electronic Publishing GmbH – a Moody’s Analytics company and ECB calculations.
Notes: Panel a: based on an unbalanced sample of 251 MFIs (consolidated). Panel b: the dashed grey line marks the start of the hiking cycle in July 2022. Panels b and c: based on an unbalanced sample of 103 MFIs at the highest level of consolidation.
3 Use of derivatives to manage interest rate risk
Banks can manage their interest rate risk either by changing the composition of their balance sheets or by actively using derivatives for hedging purposes. The first approach, known as natural hedging, involves aligning the interest rate sensitivity of assets and liabilities. In this way, banks’ cash flows generated from asset exposures offset those stemming from their liabilities along the repricing schedule. Alternatively, banks can use derivatives contracts linked to interest rate fluctuations to reduce the duration gap between assets and liabilities without altering their balance sheet structures. This means that banks actively trade in the interest rate derivatives market to manage their interest rate risk.[5]
Euro area banks have increased their positions in interest rate derivatives over the last two years. The gross notional traded on EURIBOR interest rate swaps (IRS) and forward rate agreements (FRA) by euro area counterparties rose significantly between September 2021 and June 2023.[6] The bulk of this increase took place after the ECB announced the end of net purchases under its pandemic emergency purchase programme but before the actual start of the hiking cycle.[7] This might reflect the positioning on interest rate derivatives adopted by banks and other informed investors in anticipation of the start of monetary policy normalisation. Significant institutions and savings banks increased their interest rate derivatives positions substantially during this period, although their greater reliance on derivatives was not sufficient to compensate for the material increase in interest rate risk (Box A). The overall positioning of cooperative banks remained broadly unchanged, but their mix of instruments shifted towards interest rate derivatives with longer maturities (Chart A.3, panel a). Similarly, savings banks tend to trade derivatives contracts with longer maturities, reflecting their greater maturity transformation.
Chart A.3
Banks’ net exposures to interest rate derivatives have increased, and cooperatives have shifted their instrument mix towards longer maturities since rate hikes started
a) Net absolute notional in EURIBOR IRSs and FRAs, by bank type | b) Gross notional outstanding in EURIBOR IRS and FRAs of cooperative and savings banks with other euro area banks |
|---|---|
(percentage of total assets) | (June 2023, € billions) |
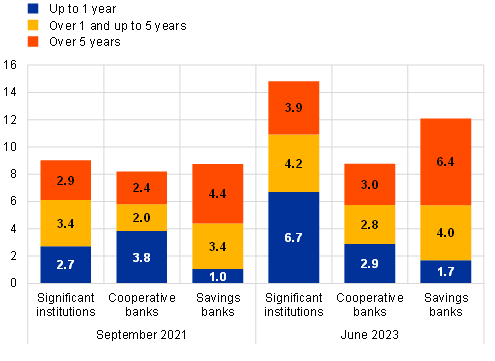 | 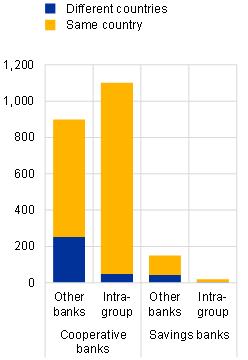 |
Sources: BvD Electronic Publishing GmbH – a Moody’s Analytics company, ECB (iMIR, EMIR, RIAD) and ECB calculations.
Notes: Panel a: at the end of each period, the absolute value of contracts netted at the counterparty and the maturity level is divided by the total assets of banks belonging to each specialisation group. The net absolute notional is defined as the absolute value of the difference between buying and selling positions on EURIBOR IRSs and FRAs, irrespective of whether counterparties are active in EURIBOR IRSs and FRAs, in each of the maturity buckets “Up to 1 year”, “Over 1 and up to 5 years” and “Over 5 years”. Panel b: “Intragroup” refers to interest rate derivatives positions among banks identified at solo level and belonging to the same group.
Significant institutions tend to rely on interest rate derivatives to a larger extent than cooperative and savings banks. Their somewhat greater reliance on interest rate derivatives may be linked to their ability to leverage more sophisticated risk management frameworks.[8] Cooperative and savings banks affiliated with central cooperative or savings banks (CCBs) frequently enter the derivatives market indirectly by trading with their parent, which often nets positions across subsidiaries to hedge the resulting bundled trades (Chart A.3, panel b). The benefits arising from exploiting offsetting positions might, however, leave the CCB with some interest rate risk if the hedge is not perfect.
The use of interest rate derivatives differs by bank type, with large banks’ positionings being more mixed. The net directional positioning in interest rate derivatives differs more among significant institutions than among cooperative banks and savings banks (Chart A.4).[9] The positioning of significant institutions, as either net buyers or net sellers, might reflect the diversity of their duration gaps.[10] In addition, some large banks could also be active in this market with the aim of speculating on interest rate movements or acting as market-makers or clearing members. Cooperative and savings banks mostly enter the interest rate derivatives market as net buyers of EURIBOR IRSs and FRAs.[11] Only a few such banks are net sellers, and the extent of net sales is limited to less than 2% of their total assets (Chart A.4). This suggests that these banks, along with their wider maturity gap, use interest rate derivatives mostly for hedging purposes.
Chart A.4
Significant institutions exhibit more diverse interest rate derivatives positions
Distribution of net notional outstanding on EURIBOR IRSs and FRAs over total assets
(Q4 2018-Q3 2023, percentages)
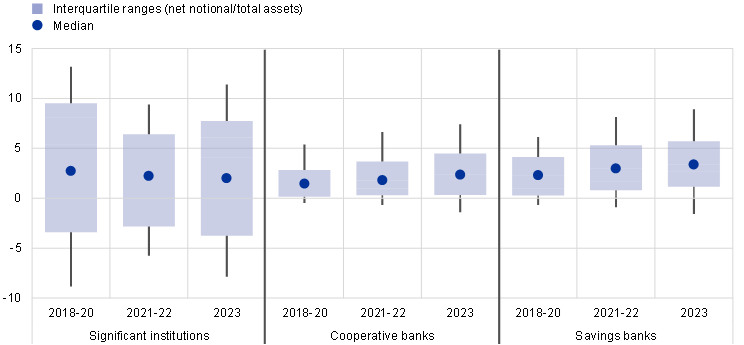
Sources: BvD Electronic Publishing GmbH – a Moody’s Analytics company, ECB (iMIR, EMIR) and ECB calculations.
Notes: See notes to Chart A.3. For the number of banks included in each specialisation group, see footnote 4. Bars show the interquartile ranges while whiskers are winsorised at the 10th and 90th percentiles. Positive (negative) values indicate net buyers (sellers), i.e. notional values on pay-fix receive-float positions are larger (smaller) than pay-float receive-fix positions.
4 Impact of maturity transformation on bank net interest margins
Bank profitability generally benefits from rising interest rates. In the current context of rising interest rates, euro area banks’ net interest margins increased from their recent minimum of 1.2% in the third quarter of 2021 to 1.5% in the second quarter of 2023, benefiting from the widening of the loan-deposit margin (Chart A.5, panel a). Indeed, changes in the level of interest rates and the slope of the yield curve can affect banks’ net interest margins. An increase in interest rates may improve banks’ NIMs in line with the “retail deposits endowment effect”, according to which overnight deposit rates are priced at a markdown on market rates and tend to be sticky upwards.[12] Since retail deposits represent the largest component of bank liabilities, an increase in interest rates results in improved NIMs as assets reprice or mature faster than liabilities. A change in the shape of the yield curve could also affect banks’ NIMs. Since banks engage in maturity transformation, a steepening of the yield curve may provide more of a boost to longer-term yields than to short-term yields, raising the rate on interest-earning assets more than the cost of liabilities.
Chart A.5
Higher short-term interest rates and a steeper yield curve have, on average, a positive impact on euro area banks’ margins
a) NIM and loan-deposit margin on outstanding volumes | b) Estimated NIM impact of an increase in the short-term rate and the slope of the yield curve |
|---|---|
(Q1 2016-Q2 2023; percentage points, percentages) | (basis points) |
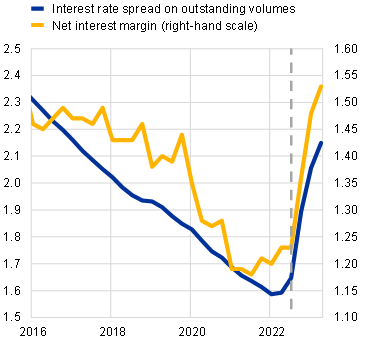 |  |
Sources: BvD Electronic Publishing GmbH – a Moody’s Analytics company, LSEG, ECB (iMIR, supervisory data) and ECB calculations.
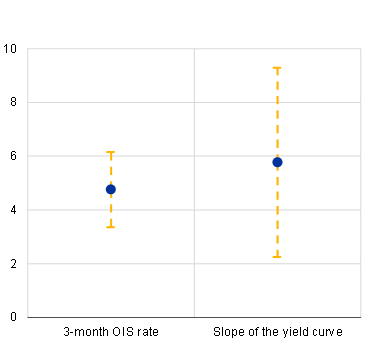
Notes: Panel a: the dashed grey line marks the start of the hiking cycle in July 2022. The net interest margin is defined as net interest income divided by total earning assets. The interest rate spread (loan-deposit margin) is calculated as the difference between the weighted average rate on outstanding loans to non-financial corporations (NFCs) and households and the weighted average rate on outstanding deposits from NFCs and households using the outstanding amounts as weights. Panel b: the blue dots represent the point estimates, while the dashed yellow lines show the 90% confidence bands. The sample period runs from Q4 2014 to Q2 2023. The slope is calculated as the difference between the yields on government bonds with a residual maturity of ten years and two years. The regressions control for a wide range of bank-specific characteristics such as the logarithm of total assets, the CET1 ratio, the ratio of liquid assets to total assets, the cost/income ratio, the ratio of risk-weighted assets to total assets, the ratio of loans to total assets, the ratio of deposits to total assets and macro-level controls such as annual GDP growth and inflation. The regressions are saturated with bank fixed effects and standard errors are clustered at the bank level. The regressions are estimated on a balanced sample of 122 significant institutions and less significant institutions. The estimated impact represents the effect of a 1 percentage point increase in the three-month OIS rate and a 1 percentage point increase in the country-specific slope of the yield curve.
The empirical evidence confirms that an increase in short-term rates and a steepening of the yield curve support bank margins. Bank-level estimations, regressing the NIM on the level of the short-term rate and the slope of the yield curve while controlling for a large set of bank- and country-specific characteristics, confirm the empirical evidence in the literature. At impact there is a positive and statistically significant relationship between NIM and both the level of the short-term rate and the slope of the yield curve (Chart A.5, panel b). More specifically, the estimated coefficients suggest that a 1 percentage point increase in the three-month overnight index swap (OIS) rate increases the NIM by 4.8 basis points, while a 1 percentage point increase in the slope of the yield curve has a positive impact of 5.8 basis points.[13] The estimated coefficients do not capture longer-term effects, which could differ from the results at impact once the liability repricing catches up and credit risk may arise.
Chart A.6
The impact of higher short-term interest rates and a steeper yield curve on bank margins varies with the extent of maturity transformation and across bank types
a) Differential estimated impact on the NIM for banks with higher maturity gaps | b) Differential estimated impact on the NIM for cooperative and savings banks versus significant institutions |
|---|---|
(basis points) | (basis points) |
 |  |
Sources: BvD Electronic Publishing GmbH – a Moody’s Analytics company, LSEG, ECB (iMIR, supervisory data) and ECB calculations.
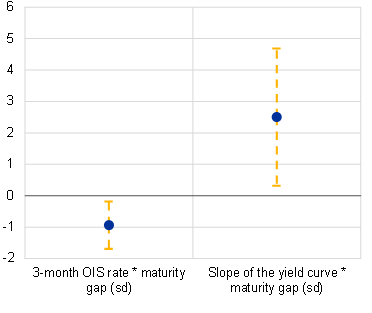
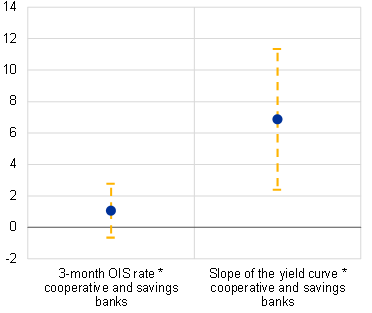
Notes: The blue dots represent the point estimates, while the dashed yellow lines show the 90% confidence bands. For details on the sample period and included variables, see notes under Chart A.5. The regressions are saturated with bank and time fixed effects and standard errors are clustered at the bank level. Panel a: regressions are estimated on a balanced sample of 122 significant institutions and less significant institutions. The estimated impact represents the differential effect of a 1 percentage point increase in the three-month OIS rate and a 1 percentage point increase in the country-specific slope of the yield curve for a bank with a maturity gap that is one standard deviation above the sample average. Panel b: regressions are estimated on a balanced sample of 48 significant institutions and 42 cooperative and savings banks. The estimated impact represents the differential effect of a 1 percentage point increase in the three-month OIS rate and a 1 percentage point increase in the country-specific slope of the yield curve for cooperative and savings banks compared with significant institutions.
Banks with a wider maturity gap benefit less from a change in short-term rates and more from a steepening of the yield curve. The empirical evidence also shows that a higher maturity gap has a significantly negative impact on the relationship between the NIM and the short-term rate (Chart A.6, panel a). A bank with a maturity gap that is one standard deviation above the sample average exhibits an increase in its NIM that is 1 basis point smaller in response to a 1 percentage point increase in the short-term rate.[14] This is consistent with the view that banks with a larger mismatch between the repricing schedules of their assets and their liabilities will benefit less from parallel shifts in interest rates. This is because, all else equal, their liabilities reprice faster than banks with a narrower mismatch, leading to a smaller increase in margins. By contrast, a higher maturity gap has a positive and statistically significant impact on the relationship between the NIM and the slope of the yield curve (Chart A.6, panel a). A bank with a maturity gap that is one standard deviation above the sample average exhibits an increase in its NIM that is 2.5 basis points stronger in response to a 1 percentage point steepening of the yield curve compared with a bank with a maturity gap at the sample average. Indeed, banks engaging in maturity transformation benefit more from a steepening of the yield curve which, by raising long-term yields more than short-term yields, induces a greater increase in interest-earning assets than interest-bearing liabilities for these banks.
The margins of cooperative and savings banks gain more from a steepening of the yield curve than significant institutions’ margins. As cooperative and savings banks engage more in maturity transformation than significant institutions (Chart A.2, panels b and c), the NIMs of these banks benefit more from a steepening of the yield curve (Chart A.6, panel b). More specifically, the NIMs of savings and cooperative banks increase by 6.9 basis points more than the NIMs of significant institutions in response to a 1 percentage point increase in the slope of the yield curve. The effect of an increase in the short-term rate is not found to be significantly different for the various types of banks.
5 Conclusions
The extent to which bank margins benefit from higher interest rates depends on the maturity mismatch between their assets and their liabilities. The maturity gap, a measure of maturity mismatch, started to decline at the end of 2021. The maturity gap differs across euro area countries and bank types, depending on country-level interest rate fixation conventions and bank business model characteristics. Cooperative and savings banks appear to have a larger maturity gap than significant institutions owing to their more diversified business models.
Banks with longer asset duration managed to sustain margins better during the period of ultra-low interest rates but may experience only a delayed positive impact from higher rates. Euro area banks’ NIMs were compressed for several years during the period of ultra-low interest rates when banks sustained their profitability by extending loans with longer maturities and collecting the term premium. Customers, for their part, took the opportunity to lock in historically low interest rates over an extended period. However, the loans granted at that time with long interest rate fixation periods offer limited potential for benefiting from higher rates, as such assets are repriced at a slower pace. At the same time, higher interest rates make the funding of legacy long-term, fixed-rate assets increasingly challenging. As such, while rising interest rates impact banks’ margins positively overall, the profitability of significant institutions, which are characterised by a higher share of variable-rate lending, has benefited more from the recent fast increase in interest rates.
Banks have started to adjust their balance sheets and hedging practices as expectations of monetary policy tightening begin to materialise. With the start of monetary policy normalisation, banks have in aggregate increased their reliance on interest rate derivatives. Less sophisticated banks, such as cooperative and savings banks, have larger maturity gaps but do not use interest rate derivatives as much as their larger peers do. Significant institutions are more varied in their interest rate derivatives positionings, possibly reflecting more diverse duration gaps, their role as clearing members or market-makers, or speculative behaviour. Significant institutions and savings banks have significantly increased their interest rate derivatives positioning since September 2021. The overall positioning of cooperative banks has remained largely unchanged, but their mix of instruments has shifted towards interest rate derivatives with longer maturities.
Box A
How is the banking sector coping with increased interest rate risk?
Uncertainty over the future path of interest rates exposes banks to interest rate risk. The usual maturity mismatch between bank assets and liabilities means that banks are exposed to interest rate risk. Banks can mitigate this risk by using interest rate swaps and other interest rate derivatives. As the extent to which banks hedge interest rate risk is a key determinant of the resilience of credit intermediation to shocks in the yield curve, their interest rate risk management matters for financial stability.
This box uses supervisory and market data to examine how effectively banks use interest rate derivatives to mitigate interest rate risk. The impact of changes in the yield curve on the economic capital of a bank can be measured as the change in the bank’s economic value of equity (EVE) – defined as the net present value of future expected cash flows. Quarterly supervisory data[15] can be used to infer bank-level sensitivities[16] of EVE to yield curve shocks. Building an EVE risk distribution at the level of individual banks also requires a probability distribution of future changes to the yield curve. This can be constructed from two types of market data that are available on a daily basis: the EUR yield curve and the corresponding implied swaption volatilities for the different tenors of the curve. After aggregation across banks, the standard deviation of the resulting EVE risk distribution is used as a measure of system-level interest rate risk.
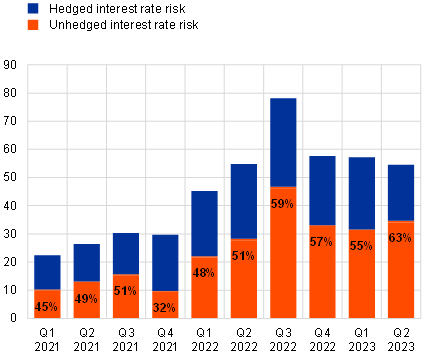
Compared with 2021, the effectiveness with which banks hedge interest rate risk has declined as the risk level has increased. Leveraging a breakdown of the data provided by the ECB’s Short Term Exercise (STE) into derivative and non-derivative positions makes it possible to calculate the hypothetical interest rate risk while excluding derivatives and the portion of interest rate risk hedged by derivatives. Elevated uncertainty regarding the path of interest rates reflected by swaption volatilities, together with longer bank asset maturities, drove the exposure of euro area banks to interest rate risk to a peak in the third quarter of 2022 (Chart A, panel a). Swaption volatilities have increased significantly across all tenors of the yield curve since 2021 (Chart A, panel b). At the same time, the duration of banks’ non-derivative banking book positions has increased by about 35%. In line with earlier findings, derivatives have a mitigating effect (i.e. the hedged portion is positive).[17] However, this mitigating effect has not been sufficient to counterbalance the two drivers of increased interest rate risk (Chart A, panel a).
Chart A
Interest rate risk and swaption volatilities have increased markedly since 2021, while banks’ hedging effectiveness has declined
a) Hedged and unhedged interest rate risk in the euro area | b) Swaption volatilities for the euro |
|---|---|
(Q1 2021-Q2 2023; € billions) | (maturity in years, basis points) |
 | 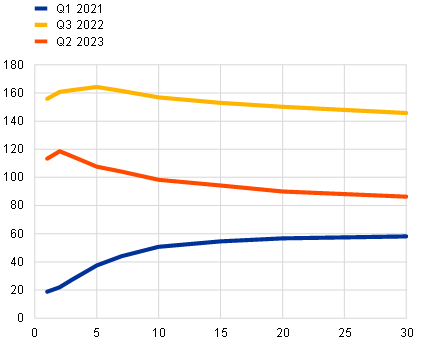 |
Sources: ECB (supervisory data), Bloomberg Finance L.P. and ECB calculations.
Notes: Panel a: the change in interest rate risk is calculated on the basis of the euro-denominated banking book positions of a panel of 89 banks. Each bank reports a repricing ladder for its assets, liabilities and derivatives. This is a breakdown by the earliest time at which the interest rate of a given position might be reset. Percentages inside bars indicate remaining risk, i.e. the share of interest rate risk not mitigated with interest rate derivatives. Panel b: volatilities implied by prices of swaptions with an expiry in one year for the period 2021-23.
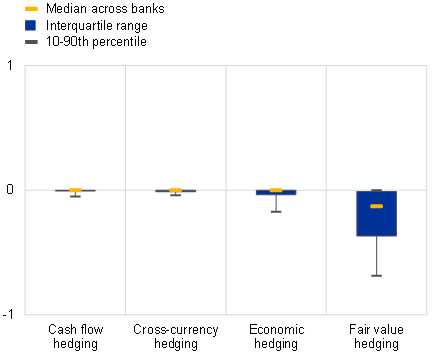
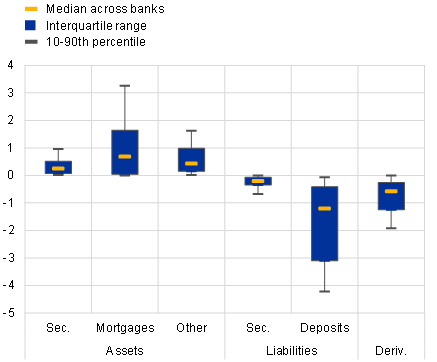
Banks’ hedging has served first and foremost to avoid profit and loss swings due to fair value accounting rather than to mitigate interest rate risk in the banking book (IRRBB) more effectively. Under the International Financial Reporting Standards, interest rate changes only have an immediate impact on income or capital for positions carried at fair value. Banks can use fair value hedges to offset corresponding revaluation impacts, which has been the strategy for hedging interest rate risk adopted by euro area banks (Chart B, panel a). The banking book consists of positions held at fair value and positions held at amortised cost: the latter include mortgages and contribute more to IRRBB (Chart B, panel b), but have generally not been hedged with derivatives (Chart B, panel a).
Chart B
In the euro area, positions carried at amortised cost that contribute more to IRRBB than fair value positions have generally not been hedged with derivatives
a) Contribution of hedging derivatives to duration gap | b) Contribution of selected balance sheet items to duration gap |
|---|---|
(years) | (years) |
 |  |
Sources: EBA and ECB calculations.
Notes: Panel a: the chart shows the impact of hedging instruments on the overall duration gap. Panel b: the chart shows the impact of selected balance sheet items on the overall duration gap. The impact is determined by excluding the item and comparing it with the full duration gap. The boxes represent the 25-75th interquartile range, the whiskers denote the 10-90th percentile, and the yellow line denotes the median. “Sec.” stands for securities; “Deriv.” stands for derivatives.
The interest rate risk of euro area banks remains elevated and is only partly hedged. Despite subsiding slightly since its peak in the third quarter of 2022, interest rate risk remains elevated. In addition, less than half of the exposure has been effectively hedged. Adverse changes to the yield curve could therefore reduce the economic capital of the banking sector, particularly if these shocks were to persist.
Changes in interest rates affect banks’ interest-sensitive income and expenses and, over time, their profitability. Changes also have an immediate impact on the value of a bank’s assets and liabilities through changes in the present value and the timing of future cash flows. The bank’s economic value of equity is also affected accordingly. While banks’ aggregate profitability benefits from rising interest rates and a steepening yield curve, their economic value of equity is likely to be negatively affected.
The definition of maturity gap follows the approach used by Altavilla, C., Boucinha, M. and Peydró, J.-L., “Monetary policy and bank profitability in a low interest rate environment”, Economic Policy, Vol. 33, Issue 96, 2018, pp. 531-586. One caveat is that the data used to calculate the maturity gap provide information on the contractual time to reprice and do not account for behavioural assumptions. This is especially relevant for the calculation of the effective time for mortgages and overnight deposits to reprice as contractual repricing does not account for loan prepayments and/or the fact that the behavioural repricing of overnight deposits is longer than the contractual repricing. Similar measures, covering banks’ full balance sheets, are used by English, W., Van den Heuvel, S. and Zakrajšek, E., “Interest rate risk and bank equity valuations”, Journal of Monetary Economics, Vol. 98, Issue C, 2018, pp. 80-97, and Drechsler, I., Savov, A. and Schnabl, P., “Banking on Deposits: Maturity Transformation without Interest Rate Risk”, Journal of Finance, Vol. 76, Issue 3, 2021, pp. 1091-1143.
For more details, see the box entitled “Euro area bank deposit costs in a rising interest rate environment”, Financial Stability Review, ECB, May 2023.
Cooperative and savings banks are defined based on the field specialisation provided by BvD Electronic Publishing GmbH – a Moody’s Analytics company and are validated at the country level using data from the European Association of Co-operative Banks and the European Savings and Retail Banking Group. Significant institutions reflect the list of euro area banks supervised by the ECB and are reclassified as either cooperative banks or savings banks if BvD Electronic Publishing GmbH – a Moody’s Analytics company considers their business model to be attributable to these specialisations. Banks’ balance sheets are captured at the highest level of consolidation, where available. This sample of banks consists of 81 significant institutions, 1,403 cooperative banks and 407 savings banks, covering €19 trillion, €8 trillion, and €2.6 trillion of total assets at year-end 2022 respectively. However, data on time for loans and deposits to reprice are more limited. iMIR covers only 55 significant institutions, 23 cooperative banks and 21 savings banks, representing 85%, 44% and 34% of the starting sample in terms of total assets respectively. 67 significant institutions, 395 cooperative banks and 341 savings banks report under EMIR and they account for 97%, 90% and 93% of the starting sample in terms of total assets respectively.
See the boxes entitled “Interest rate risk exposures and hedging of euro area banks’ banking books”, Financial Stability Review, ECB, May 2022, and “Euro area interest rate swaps market and risk-sharing across sectors”, Financial Stability Review, ECB, November 2022.
EURIBOR IRSs and FRAs are the most traded and liquid derivatives used to manage interest rate risk for euro-denominated exposures. Together they accounted for around three-quarters of the gross notional derivatives outstanding in the euro area as at mid-2023.
Longer-term market rates had already started rising in this period as expectations for future interest rate hikes began to strengthen.
See Esposito, L., Nobili, A. and Ropele, T., “The management of interest rate risk during the crisis: Evidence from Italian banks”, Journal of Banking & Finance, Vol. 59, Issue C, 2015, pp. 486-504, and Purnanandam, A., “Interest rate derivatives at commercial banks: An empirical investigation”, Journal of Monetary Economics, Vol. 54, Issue 6, 2007, pp. 1769-1808.
The directional positioning in interest rate derivatives is proxied by the ratio of net notional on EURIBOR IRSs and FRAs to banks’ total assets.
Banks with a positive duration gap can hedge their exposures by taking positions in IRSs as net buyers, while banks with a negative duration gap can hedge their exposures by acting as net sellers. On average, banks are net buyers while insurance companies and pension funds are net sellers. Market-makers are the main counterparty of banks.
Banks, which are net buyers, have long positions and their cash flow results from paying the fixed-rate EURIBOR and receiving the floating-rate EURIBOR.
See Albertazzi, U. and Gambacorta, L., “Bank profitability and the business cycle”, Journal of Financial Stability, Vol. 5, 2009, pp. 393-409; Alessandri, P. and Nelson, B.N., “Simple banking: Profitability and the yield curve”, Journal of Money, Credit and Banking, Vol. 47, 2015, pp. 143-175; Borio, C., Gambacorta, L. and Hofmann, B., “The influence of monetary policy on bank profitability”, International Finance, Vol. 20, 2017, pp. 48-63; and English, W.B., Van den Heuvel, S.J. and Zakrajšek, E., “Interest rate risk and bank equity valuation”, Journal of Monetary Economics, Vol. 98, 2018, pp. 80-97.
This result is confirmed by several studies, including Samuelson, P.A., “The effect of interest rate increases on the banking system”, American Economic Review, Vol. 35, 1945, pp.16-27; English, W.B., “Interest rate risk and bank net interest margins”, BIS Quarterly Review, BIS, December 2002; and Claessens, S., Coleman, N.C. and Donnelly, M., “‘Low-for-long’ interest rates and banks’ interest margins and profitability: Cross-country evidence”, Journal of Financial Intermediation, Vol. 35, 2017, pp. 1-16.
On average, the maturity gap in the sample is 40 months while the standard deviation is 31 months.
These data are part of the STE conducted by the ECB for the purposes of the Supervisory Review and Evaluation Process (SREP).
The sensitivity contribution of non-maturity deposits is based on banks’ internal models subject to STE reporting instructions.
See the box entitled “Interest rate risk exposures and hedging of euro area banks’ banking books”, Financial Stability Review, ECB, May 2022.