


Published as part of the ECB Economic Bulletin, Issue 8/2023.
Economic activity in the euro area has slowed down in both manufacturing and services.[1] Since the end of 2021, economic activity, measured in terms of real gross value added, has grown at a significantly faster pace in the market services sector – i.e. services excluding public administration, education, health and social services – than in the manufacturing sector (Chart A). This has reflected, on the one hand, relatively buoyant demand for contact-intensive services, supported by the reopening of the economy following the pandemic, and, on the other hand, weak demand for goods, global supply bottlenecks and, later, the tightening of financing conditions induced by the monetary policy response to the rapid and strong increase in inflation.[2] However, services activity, which typically follows manufacturing in the business cycle, has also weakened recently.[3] This box looks at the leading properties of manufacturing activity in the euro area for market services, focusing on the role of monetary policy.
Chart A
Manufacturing and services activity in the euro area
(year-on-year percentage changes)
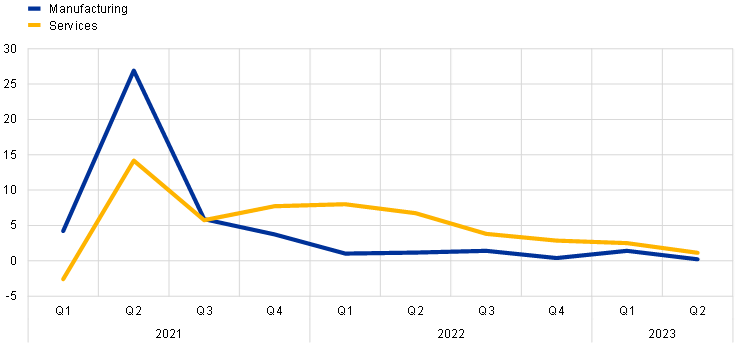
Sources: Eurostat and ECB calculations.
Notes: Manufacturing refers to real gross value added in NACE Rev. 2 classification sector C, excluding Ireland. Services refers to real gross value added in NACE Rev. 2 classification sectors G to N and R to U (market services).
A lead-lag analysis shows that manufacturing activity leads services activity over the business cycle. The analysis estimates correlation coefficients at different leads and lags of manufacturing and services activity from the first quarter of 1999 to the second quarter of 2023, both for the full sample and for five-year rolling windows. The results show that manufacturing appears to lead services, although recently to a slightly lesser extent, whereas no clear leading relation can be established in the other direction (Chart B). These results hold at different horizons and are confirmed by Granger causality tests, which suggest that manufacturing activity predicts activity in services better than vice versa. This property of manufacturing can be explained by several characteristics of goods relative to services, such as their greater dependence on foreign demand through trade and competitiveness channels, the longer supply chains and higher working capital needed for their production, as well as their greater durability. Further, input-output linkages between the two sectors tend to induce spillover effects that, on average, go mainly from manufacturing to services.[4] These features mean that manufacturing activity typically reacts more strongly and quickly to certain economic shocks, such as changes in interest rates.[5] Overall, the results suggest that the dynamics in manufacturing contain information relevant to the near-term dynamics in services, and thus for the rest of the economy. At the current juncture, however, this may not yet be fully apparent, owing to the effects of the reopening of the economy, which have supported activity in the services sector.[6]
Chart B
Leading relationship between manufacturing and services activity
(lead-lag relationship: correlation coefficient; Granger causality: one minus p-value)
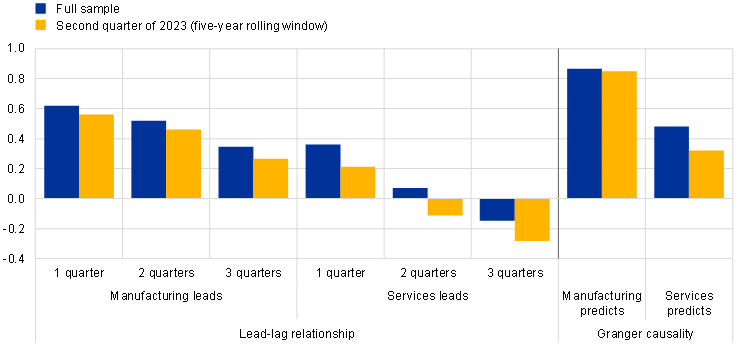
Sources: Eurostat and ECB calculations.
Notes: The Granger causality tests are based on vector autoregression models with three variables, namely real gross value added in manufacturing, services and the rest of the economy, estimated between the first quarter of 1999 and the second quarter of 2023. The measure of one minus p-value refers to the probability that the hypothesis of no Granger causality can be rejected.
An empirical model confirms that monetary policy shocks have a greater impact on manufacturing than on services. A Bayesian structural vector autoregression (BSVAR) model includes genuine monetary policy surprises as reflected in changes in one-year overnight index swap (OIS) risk-free rates around the ECB’s monetary policy announcements to help identify monetary policy shocks (i.e. unexpected changes in interest rates). It also includes the one-year government bond yield, economic activity in manufacturing, services and the rest of the economy, as well as other domestic and foreign variables.[7] The monetary policy shocks are assumed to induce increases in the movements in OIS rates and the government bond yield on impact and reduce economic activity over the following year. The results suggest that monetary policy shocks have an impact on manufacturing that is almost twice as strong and around two quarters faster than their impact on services, broadly in line with recent evidence from different empirical tools (Chart C).[8] This stronger and faster reaction of manufacturing to unexpected interest rate changes helps explain its leading property in the business cycle and suggests that monetary policy tightening may, among other factors, be playing an important role in the speed of the slowdown in manufacturing and services activity.
Chart C
Average impact of monetary policy tightening shocks on manufacturing and services activity
(percentage changes)
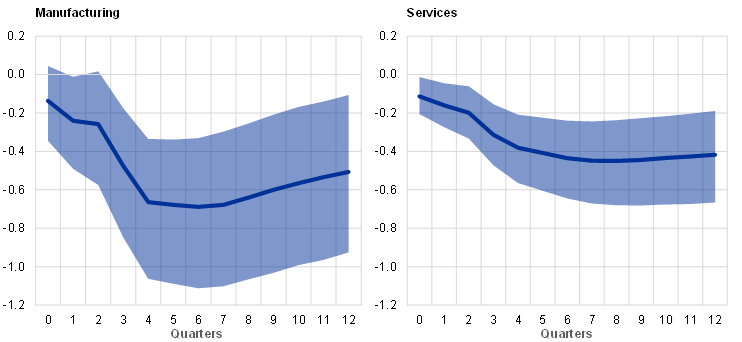
Sources: Eurostat, Eurosystem, Altavilla et al., op. cit., and ECB calculations.
Notes: The chart shows BSVAR-based impulse response functions of manufacturing and services activity to a one-standard deviation monetary policy tightening shock. The solid lines represent median responses and the shaded areas represent the 68% credibility bands (the responses are also significant at the 90% credibility level). The monetary policy shocks are identified with sign restrictions using genuine monetary policy surprises as reflected in changes in one-year OIS rates around the ECB’s monetary policy announcements as instruments. The monetary policy shocks are assumed to induce increases in the movements in OIS rates and the government bond yield of the corresponding maturity on impact and reduce economic activity over the following year. All other shocks included in the model are assumed to have a smaller absolute impact on the movements in OIS rates than the monetary policy shocks.
The recent tightening of monetary policy has increasingly weighed on economic activity during 2023. According to the model, the tightening induced by monetary policy shocks started to affect economic activity as early as the third quarter of 2022, when the ECB first raised interest rates, a few quarters after the first announcement of a normalisation of monetary policy at the end of 2021 (Chart D). As interest rates continued to rise and the impact of previous shocks built up over time, the negative effects of the monetary tightening intensified in the first half of 2023, with manufacturing affected at a quicker pace and to a greater extent than services. According to the model, the monetary policy effects are also likely to have increased further in the second half of 2023 as they continued to ripple through the economy, partly as a result of the significant lag in the reaction of the services sector. Importantly, these results capture only the impact of monetary policy shocks and not the broader rise in interest rates reflecting the systematic response of monetary policy to the increase in inflation. The latter should suggest a larger effect of the recent monetary policy tightening on activity, going beyond the impact of the identified monetary policy shocks.[9]
Chart D
Actual impact of monetary policy shocks on manufacturing and services activity
(percentage changes since the fourth quarter of 2021)
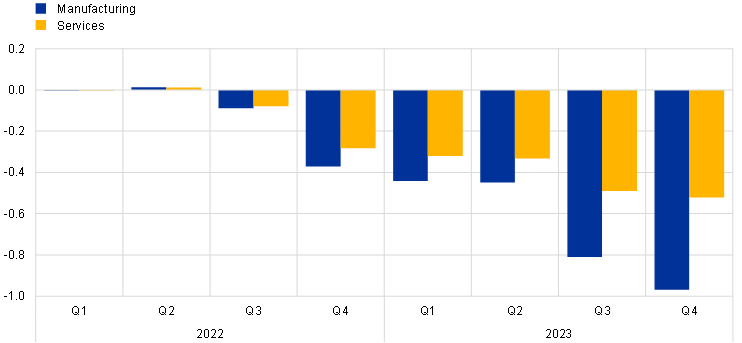
Sources: Eurostat, Eurosystem, Altavilla et al., op. cit., and ECB calculations.
Notes: The chart shows BSVAR-based effects of monetary policy shocks on manufacturing and services activity from the first quarter of 2022 to the fourth quarter of 2023. The effects for the third and fourth quarters of 2023 are based on the projected effects of the estimated monetary policy shocks up to the second quarter of 2023. For details on the identification of monetary policy shocks, see the notes to Chart C.
The measure for manufacturing activity refers to the euro area aggregate excluding Ireland, on account of the considerable volatility in Irish intellectual property products. See the box entitled “Intangible assets of multinational enterprises in Ireland and their impact on euro area GDP”, Economic Bulletin, Issue 3, ECB, 2023.
See the box entitled “What role do reopening effects play across countries and sectors?”, Economic Bulletin, Issue 6, ECB, 2023; the box entitled “The impact of higher energy prices on services and goods consumption in the euro area”, Economic Bulletin, Issue 8, ECB, 2022; as well as the article entitled “The role of supply and demand in the post-pandemic recovery in the euro area”, Economic Bulletin, Issue 4, ECB, 2023.
For a survey-based analysis, see the box entitled “The drivers of recent developments in business activity expectations across sectors”, Economic Bulletin, Issue 7, ECB, 2023.
Within the services sector, these spillover effects are particularly relevant for business services. See, for example, the box entitled “Developments in the services sector and its relationship with manufacturing”, Economic Bulletin, Issue 7, ECB, 2019. However, the effects may also go in the other direction, i.e. from services to manufacturing, in a context of large services-specific shocks, such as the restrictions on mobility and the reopening of the economy observed since the start of the pandemic.
See, for example, Dedola, L. and Lippi, F., “The monetary transmission mechanism: Evidence from the industries of five OECD countries”, European Economic Review, Vol. 49, No 6, 2005, pp. 1543-1569; Peersman, G. and Smets, F., “The Industry Effects of Monetary Policy in the Euro Area”, The Economic Journal, Vol. 115, No 503, 2005, pp. 319-342; and Hahn, E., “The impact of exchange rate shocks on sectoral activity and prices in the euro area”, Working Paper Series, No 796, ECB, 2007.
See the box entitled “What role do reopening effects play across countries and sectors?”, Economic Bulletin, Issue 6, 2023.
The BSVAR model uses euro area data from the first quarter of 1999 to the second quarter of 2023. Besides the genuine monetary policy surprises, the one-year government bond yield and the real activity variables, it includes the private consumption deflator, the effective exchange rate, foreign demand and the New York Federal Reserve Bank’s Global Supply Chain Pressure index. The model takes account of the marked volatility of macroeconomic data in 2020 by using a pandemic heteroskedasticity adjustment. See Lenza, M. and Primiceri, G., “How to estimate a vector autoregression after March 2020”, Journal of Applied Econometrics, Vol. 37, Issue 4, June/July 2022, pp. 688-699. The genuine monetary policy surprises are identified with sign restrictions using changes in one-year OIS rates and stock prices around monetary policy events from the euro area monetary policy database. A surprise monetary policy tightening is assumed to raise the OIS rates and lower stock prices in a narrow window around the policy announcement, while the opposite holds for a surprise monetary policy easing. These surprises are then summed for the respective quarter in order to obtain the same quarterly basis as for the real activity variables. See Altavilla, C., Brugnolini, L., Gürkaynak, R., Motto, R. and Ragusa, G., “Measuring euro area monetary policy”, Journal of Monetary Economics, Vol. 108, December 2019, pp. 162-179; and Jarociński, M. and Karadi, P., “Deconstructing Monetary Policy Surprises –The Role of Information Shocks”, American Economic Journal: Macroeconomics, Vol. 12, No 2, April 2020, pp. 1-43.
These results are qualitatively and quantitatively in line with previous studies indicating a stronger effect of monetary policy on manufacturing and a slightly more persistent effect on services. See Hauptmeier, S., Holm-Hadulla, F. and Nikalexi, K., “Monetary policy and regional inequality”, Working Paper Series, No 2385, ECB, 2020. See also the box entitled “Industry structure and the real effects of monetary policy”, Economic Bulletin, Issue 7, ECB, 2023.
For an assessment of the macroeconomic impact of the ECB’s recent monetary policy tightening based on a suite of different models, see the box entitled “A model-based assessment of the macroeconomic impact of the ECB’s monetary policy tightening since December 2021”, Economic Bulletin, Issue 3, ECB, 2023.