
2021 HICP weights and their implications for the measurement of inflation
Published as part of the ECB Economic Bulletin, Issue 2/2021.
The coronavirus (COVID-19) pandemic and the resulting lockdown measures have triggered extraordinary changes in consumption patterns since early 2020. Households increased their relative expenditure share of certain categories in the HICP basket at the expense of others. This box discusses these changes in consumption and their implications for inflation measurement.
HICP weights for 2021 were updated using data that also reflect 2020 household consumption expenditure.[1] The HICP is designed around a fixed basket approach according to which HICP weights are updated at the beginning of each year with a view to reflecting the previous year’s household consumption. These HICP weights are kept fixed until December of each year.[2] Because household consumption patterns tend to change gradually, using the consumption shares dating back to the previous year (instead of the current year) to compute current inflation typically has little impact. For the COVID-19 period, however, this means that the HICP weights used for compiling annual inflation in 2020 did not duly reflect the major changes in household spending triggered by the pandemic. The large shifts in 2020 household consumption are thus now reflected in the latest HICP weights that were used to compute the 2021 HICP inflation rates.[3]
The latest annual HICP weights which were introduced at the beginning of 2021 show large shifts across categories. Chart A shows the values of the HICP weights used for compiling inflation in 2020 and 2021 by special aggregates and their historical distribution over the 2012-19 period (the grey “whiskers”). The largest weight decreases can be observed in services, in particular recreation and transport, while the weight of food items and housing services increased the most.[4] The magnitude of the shifts can be better understood by looking at the distribution of historical changes (left-hand side of Chart A). For certain categories, these changes are unprecedented. Almost all items show a change in 2021 well outside the 75% interval of historical changes and many changes are significantly outside the historical boundary. For instance, the change in weight for recreation was around 20 standard deviations of the historical distribution.
Chart A
HICP weights: levels and historical changes distributions
(percentage points)

Sources: Eurostat and authors’ calculations.
Notes: The chart shows the HICP weights in 2020 and 2021 (right-hand side). A green/red line indicates whether the weights increased/decreased. The chart also shows the weight changes (blue markers on left-hand side) and their historical distributions (grey “whiskers” on left-hand side). Categories highlighted with "*" denote main special aggregates. Categories not highlighted are sub-aggregates, included in the main aggregates. The grey “whiskers” report the median, 25th percentile, 75th percentile, minimum, and maximum of the historical distribution. NEIG stands for “non-energy industrial goods”. Historical ranges are based on the sample from 2012 (the first year in which annual HICP weights became available) to 2019.
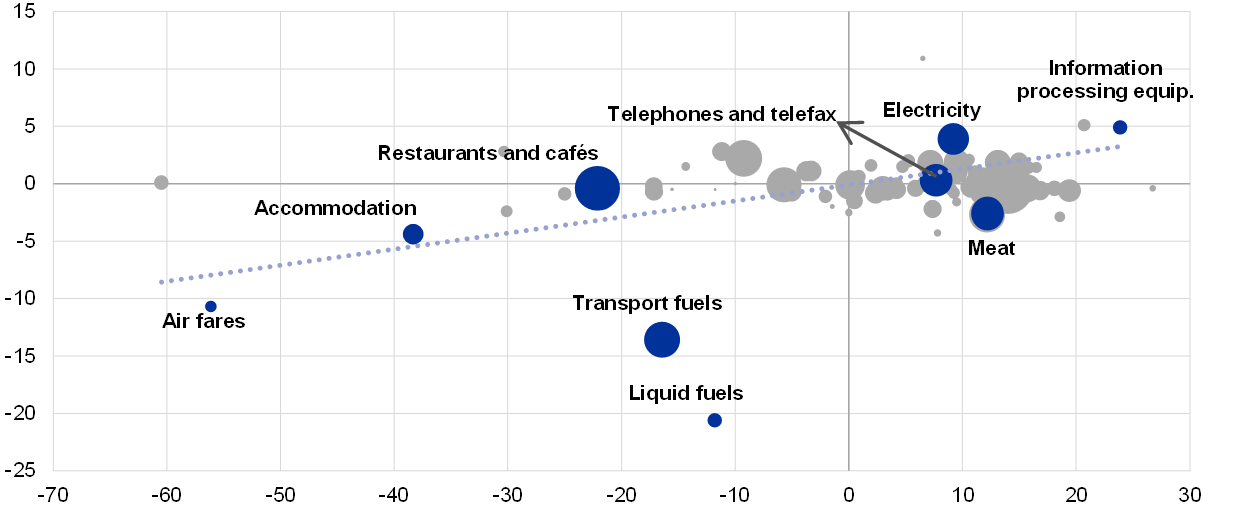
The change in weights had an upward impact on HICP inflation in January 2021. Chart B shows the change in spending weight and the corresponding change in the inflation rate by granular spending categories.[5] The size of the bubble reflects the 2021 HICP spending weight. The items with the largest decrease in the consumption share show, on average, the largest decrease in inflation.[6] Intuitively, with the change to 2021 weights, the HICP currently assigns more weight to categories with a higher-than-average inflation rate, while it assigns less weight to items with a lower-than-average inflation rate. Hence the shift in weights results in a higher aggregate inflation rate than would have been the case without shifts in consumption shares.
Chart B
Changes in HICP weights and inflation by granular spending categories
(x-axis: percentage change in HICP weights between 2020 and 2021; y-axis: change in annual inflation rates between January 2020 and January 2021)
Sources: Eurostat and authors’ calculations.
Notes: The chart shows the correlation between the change in HICP weights (x-axis) and the change in the year-over-year HICP inflation rate (y-axis). Each bubble represents an HICP item at the COICOP-4 level of aggregation. Bubbles are scaled according to the 2021 HICP weights. Blue bubbles indicate selected items. The blue dotted line is a linear fit of the data.
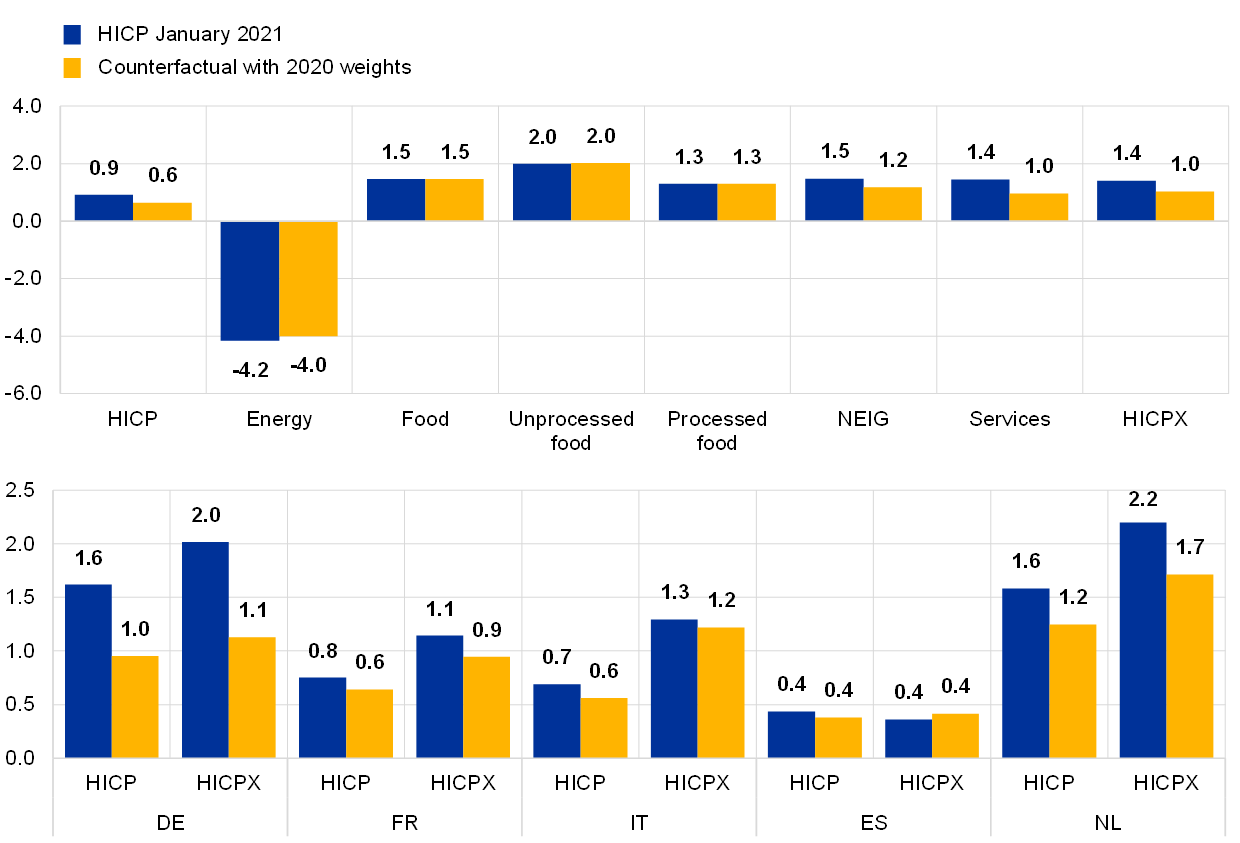
A counterfactual exercise can quantify the upward impact of the change in weights on the January 2021 HICP inflation rate. Based on the published HICP inflation rates for January 2021, we have constructed a counterfactual HICP index using the 2020 weights instead of those from 2021 (Chart C).[7] The difference between the published HICP inflation rates (blue bars) and our counterfactual inflation rates (yellow bars) in the upper panel of Chart C reflects the impact of the new weights on aggregate inflation. Headline inflation is around 0.3 percentage point higher than the counterfactual inflation rate. The HICP excluding energy and food (HICPX) inflation rate is around 0.4 percentage point higher, as the impact of the weights on food and energy inflation is limited. Nevertheless, as shown in the lower panel of Chart C, the effect across countries was heterogenous.[8]
Chart C
Published year-over-year HICP inflation rates and counterfactual inflation rates
(percentages)
Sources: Eurostat and authors’ calculations.
Notes: The chart shows the year-over-year HICP inflation rate in January 2021 (blue bars) and the counterfactual rates constructed using the 2020 weights (yellow bars). NEIG stands for “non-energy industrial goods”. HICPX stands for “HICP excluding energy and food”.
The change in weights will continue to affect HICP inflation rates throughout 2021. The magnitude and the sign of the weight impact on annual HICP inflation could change over the course of the subsequent months. While in January 2021 the weights of categories with above-average inflation rates were increased, these categories might not continue to exhibit above-average inflation rates throughout the year. As price developments in individual categories change from month to month, the weight effect on annual HICP inflation develops accordingly. The chain-linking nature of the HICP index could potentially amplify these effects.[9] Chain-linking indices at a low (high) level of the index implies that even when weights and prices return to their pre-pandemic levels, the indices themselves might not fully return to previous levels. For example, this was the case for the transport fuel sub-index, which was at a low level when the indices were linked (December 2020). In parallel, the weight was reduced, minimising future contributions from this item to the energy index. This could again lead to the energy index not fully returning to previous levels, even if both prices and weights return to their previous levels.
HICP weights will likely continue to affect the measurement of inflation more than usual over the next few years. The pandemic triggered significant changes in household spending patterns in 2020, with these shifts now being reflected in the 2021 HICP weights, and consequently also in measured inflation, across 2021. Looking further ahead, the weights of the HICP basket categories could change significantly once again in 2022, depending on whether and how spending patterns (re)adjust in the light of the expected economic recovery and the ensuing developments in the COVID-19 pandemic.
- For more information, see Eurostat methodological note. The extent to which this guidance was followed by national statistical institutes is heterogenous.
- The HICP is a Laspeyres-type index obtained by annually chain-linking 13-month (December to December) indices. December of each year is the overlap or link month in which the new and old basket of products are priced and the indices are aligned accordingly. For further details, see Eurostat HICP Methodological Manual and the legal requirements, as described in Article 3 of the HICP Implementing Act.
- For previous ECB analyses on this topic, see Consumption patterns and inflation measurement issues during the COVID-19 pandemic, Economic Bulletin, Issue 7, ECB, 2020, and Inflation measurement in times of economic distress, Economic Bulletin, Issue 3, ECB, 2020.
- The HICP spending weights are relative weights. Therefore, the weight of an item increases not only if expenditure in that item increases more than overall expenditure (such as for food items in 2020) but also if expenditure remains roughly unchanged and households cut overall expenditure (such as for housing services in 2020).
- Chart B plots HICP items at the COICOP 4-digit level of aggregation. COICOP stands for classification of individual consumption according to purpose. The HICP uses the COICOP classification system, for further details see Eurostat HICP Methodological Manual.
- Considering the annual inflation rate in January 2021 rather than the change in annual inflation rates between January 2020 and January 2021 leads to very similar results.
- In order to reproduce the exact HICP methodology, in our counterfactual exercise we used data at the COICOP 5-digit level of aggregation.
- Differences in the weight effect across countries can be caused by two factors. First, the size of the change in the country-level category weights. Cross-country differences in weight changes can reflect different developments in consumption patterns, but also the weight updating procedure used by national statistical institutes and the extent to which this duly reflected the 2020 consumption patterns. Second, differences across countries might also reflect differences in category-level inflation rates, while interacting with weight changes.
- Chain-linking is a methodological consequence of a price index, with regular weight updates being performed. As explained in Chain linking over December and methodological changes in the HICP: view from a central bank perspective, “Generally, the value in a linking period – month or year – affects a chain-linked time series from the point in time at which the recent index is linked to that value. Chain-linked index series are “path dependent”, i.e. affected by the values of each linking period, which have a permanent impact on the time series.”, Statistics Paper Series, ECB, February 2021.