
Euro area balance of payments in September 2013
In September 2013 the seasonally adjusted current account of the euro area recorded a surplus of €13.7 billion. In the financial account, combined direct and portfolio investment recorded net outflows of €12 billion (non-seasonally adjusted).
Current account
The seasonally adjusted current account of the euro area recorded a surplus of €13.7 billion in September 2013 (see Table 1). This reflected surpluses for goods (€13.7 billion), services (€7.6 billion) and income (€2.5 billion), which were partly offset by a deficit for current transfers (€10.1 billion).
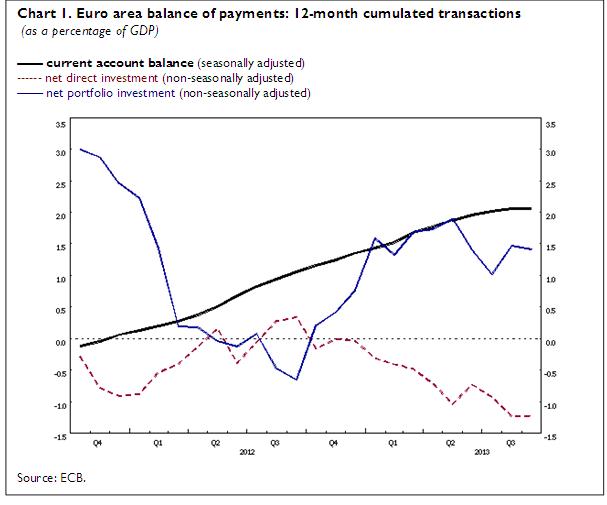
The seasonally adjusted 12-month cumulated current account for the period ending in September 2013 recorded a surplus of €196.5 billion (2.1% of euro area GDP), compared with a surplus of €100.0 billion (1.1% of euro area GDP) for the 12-month period up to September 2012 (see Table 1 and Chart 1). The increase in the surplus of the current account was due mainly to a significant increase in the surplus of goods (€161.0 billion, up from €75.1 billion) and, albeit to a lesser extent, to higher surpluses for services (€96.9 billion, after €87.4 billion) and income (€53.7 billion, after €46.5 billion).
Financial account
In the financial account (see Table 2), combined direct and portfolio investment recorded net outflows of €12 billion in September 2013, as a result of net outflows for both direct investment (€7 billion) and portfolio investment (€5 billion).
The net outflows for direct investment resulted from net outflows in equity capital and reinvested earnings (€9 billion) that were partly counterbalanced by net inflows in other capital (mostly inter-company loans) (€2 billion).
The net outflows for portfolio investment were due to net outflows in equity (€20 billion), and were counterbalanced by net inflows in debt instruments (€15 billion). The net outflows in equity were driven mainly by net purchases of foreign equities by euro area residents (€26 billion). The developments in debt instruments mainly reflected non-euro area residents’ net acquisitions of euro area money market instruments (€16 billion).
The financial derivatives account recorded net inflows of €3 billion.
Other investment recorded net outflows of €8 billion, reflecting net outflows for the Eurosystem (€9 billion) and other sectors (€3 billion), which were partly offset by net inflows for the General Government (€3 billion) and for the MFIs (excluding the Eurosystem) (€1 billion).
The Eurosystem’s stock of reserve assets decreased by €26 billion in September 2013 (to €587 billion, from €613 billion in August 2013), mainly on account of a decrease in the market price of gold.
In the 12-month period up to September 2013, combined direct and portfolio investment recorded cumulated net inflows of €17 billion, compared with net outflows of €30 billion in the 12-month period up to September 2012. This was the result of a shift in portfolio investment (from net outflows of €62 billion to net inflows of €135 billion), which was partly offset by a change in direct investment (from net inflows of €33 billion to net outflows of €118 billion).
Data revisions
This press release incorporates revisions to the data for August 2013. These revisions have not significantly altered the figures previously published for the current, capital and financial accounts.
Additional information on the euro area balance of payments and international investment position
In this press release, the seasonally adjusted current account refers to working day and seasonally adjusted data. Data for the financial account are not working day or seasonally adjusted.
In line with the agreed allocation of responsibilities, the European Central Bank compiles and disseminates monthly and quarterly balance of payments statistics for the euro area, whereas the European Commission (Eurostat; see news releases for “Euro-indicators”) focuses on quarterly and annual aggregates for the European Union. These data comply with international standards, particularly those set out in the IMF’s Balance of Payments Manual (fifth edition). The aggregates for the euro area and the European Union are compiled consistently on the basis of transactions and positions vis-à-vis residents of countries outside the euro area and the European Union respectively.
A complete set of updated euro area balance of payments statistics (including a quarterly geographical breakdown for the main counterparts) and international investment position statistics is available in the “Statistics” section of the ECB’s website under the headings “Data services”/“Latest monetary, financial markets and balance of payments statistics”. These data, as well as historical euro area balance of payments time series, can be downloaded from the ECB’s Statistical Data Warehouse (SDW). Data up to September 2013 will also be published in the December 2013 issues of the ECB’s Monthly Bulletin and the Statistics Pocket Book. Detailed methodological notes are available on the ECB’s website. The next press release on the euro area monthly balance of payments will be published on 19 December 2013. The ECB will start publishing, at the end of 2014, the euro area balance of payments and international investment position statistics in accordance with its Guideline ECB/2011/23, which adheres to the sixth edition of the IMF’s Balance of Payments and International Investment Position Manual (BPM6). More detailed information is available on a dedicated webpage
For media queries, please contact William Lelieveldt, Tel.: +49 69 1344 7316.
Annexes
Table 1: Current account of the euro area
Table 2: Monthly balance of payments of the euro area
European Central Bank
Directorate General Communications
- Sonnemannstrasse 20
- 60314 Frankfurt am Main, Germany
- +49 69 1344 7455
- media@ecb.europa.eu
Reproduction is permitted provided that the source is acknowledged.
Media contacts