
Euro area international investment position and its geographical breakdown (as at end-2004)
The international investment position of the euro area vis-à-vis the rest of the world recorded net liabilities of EUR 946 billion (representing 12.4 % of euro area GDP) at the end of 2004. Compared with the end of 2003, the net liabilities rose by EUR 137 billion. This net increase was mainly due to the appreciation of the exchange rate of the euro.
Concerning the stock of euro area direct investment abroad at the end of 2004, 24% was invested in the United Kingdom and 21% in the United States. For the stock of euro area portfolio investment abroad, the corresponding shares were 23% and 35%, respectively. The stock of foreign direct investment in the euro area also mainly originated from these two countries.
The international investment position as at end-2004
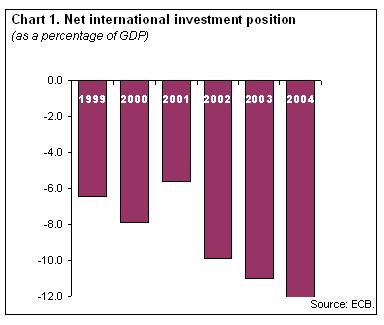
At the end of 2004, the revised international investment position (i.i.p.) of the euro area vis-à-vis the rest of the world recorded net liabilities of EUR 946 billion (representing 12.4 % of euro area GDP). This reflects an increase of EUR 137 billion in net liabilities as compared with the revised end-2003 position, which represented 11.0 % of euro area GDP (see Chart 1).
The change in the net position between end-2003 and end-2004 reflected changes not related to transactions (EUR -145 billion). Notably the appreciation of the exchange rate of the euro resulted in a lower net i.i.p. for the euro area, as euro area assets abroad are largely denominated in foreign currencies while euro area liabilities vis-à-vis the rest of the world are mostly denominated in euro. The changes related to transactions equalled EUR 8 billion, on balance.
The geographical breakdown of the international investment position as at end-2004
At the end of 2004, euro area foreign direct investment abroad amounted to EUR 2.3 trillion, 57% of which was invested in the United Kingdom (EUR 538 billion), the United States (EUR 487 billion) and offshore financial centres (EUR 272 billion). Foreign direct investment in the euro area totalled EUR 2.2 trillion, 79% of which originated from the same three counterparts. As regards net direct investment positions, the United Kingdom was the most important net investor in the euro area.
With regard to portfolio investment, euro area holdings of foreign securities amounted to EUR 3.0 trillion at the end of 2004, largely reflecting holdings of securities issued in the United States (EUR 1.1 trillion), the United Kingdom (EUR 681 billion) and offshore financial centres (EUR 310 billion). Foreign holdings of euro area securities amounted to EUR 4.0 trillion at the end of 2004.
Turning to other investment, the outstanding amount of euro area holdings abroad was EUR 2.9 trillion at the end of 2004, 43% of which was invested in the United Kingdom and 14% in the United States. On the liabilities side, other investment claims on the euro area amounted to EUR 3.1 trillion at the end of 2004, with the United Kingdom, offshore financial centres and the United States accounting for 37%, 16% and 15% respectively.
Data revisions
In addition to the end-2004 i.i.p. data, this press release incorporates a revised set of balance of payments (b.o.p.) and i.i.p. statistics since 1999.
The revisions to data from 1999 to 2001 were due to methodological changes applied in some Member States and focused on services and income from direct investment. These revisions had a downward effect on the euro area current account balance.
Moreover, the revisions to the b.o.p. decreased the 2002 current account surplus by EUR 7.1 billion, to EUR 57.3 billion, and increased the 2003 surplus by EUR 13.5 billion, to EUR 33.9 billion, reflecting new data on both income from direct investment and trade in goods. In the financial account, revisions to data for years before 2002 primarily affected direct investment, while the main change in 2003 consisted of higher net portfolio investment inflows, resulting from an increase in net inflows of euro area bonds and notes (by EUR 27.1 billion).
Revisions to the i.i.p. resulted in an increase in the euro area net debtor position in 2002, 2003 and 2004, mainly due to a higher net debtor position in debt instruments within portfolio investment.
Additional information on the euro area balance of payments and international investment position
Geographical details for the annual i.i.p. of the euro area are not available in this press release for the items portfolio investment liabilities, financial derivatives and reserve assets
A complete set of updated euro area b.o.p. and i.i.p. statistics is available on the ECB’s website in the “Statistics” section under the heading “Data services”/“Latest monetary, financial markets and balance of payments statistics”. These data can also be downloaded using the ECB Statistical DataBank Browser Interface (EBI). The results will be published in the December 2005 issue of the ECB’s Monthly Bulletin. A detailed methodological note [pdf] is available on the ECB’s website. The next press release on the euro area balance of payments including geographical details and the quarterly international investment position will be published on 30 January 2006.
Annexes
Table 1 – Annual balance of payments and international investment position of the euro area
Table 2a – Annual international investment position of the euro area with a geographical breakdown (end-2004)
Table 2b – Annual international investment position of the euro area with a geographical breakdown (end-2003)
Table 3 – Revisions to balance of payments and international investment position of the euro area
European Central Bank
Directorate General Communications
- Sonnemannstrasse 20
- 60314 Frankfurt am Main, Germany
- +49 69 1344 7455
- media@ecb.europa.eu
Reproduction is permitted provided that the source is acknowledged.
Media contacts